
Extended Data Fig. 3. High expression of SLC7A11 promote disulfide stress, deplete NADPH and causes redox system collapse under glucose deprivation.
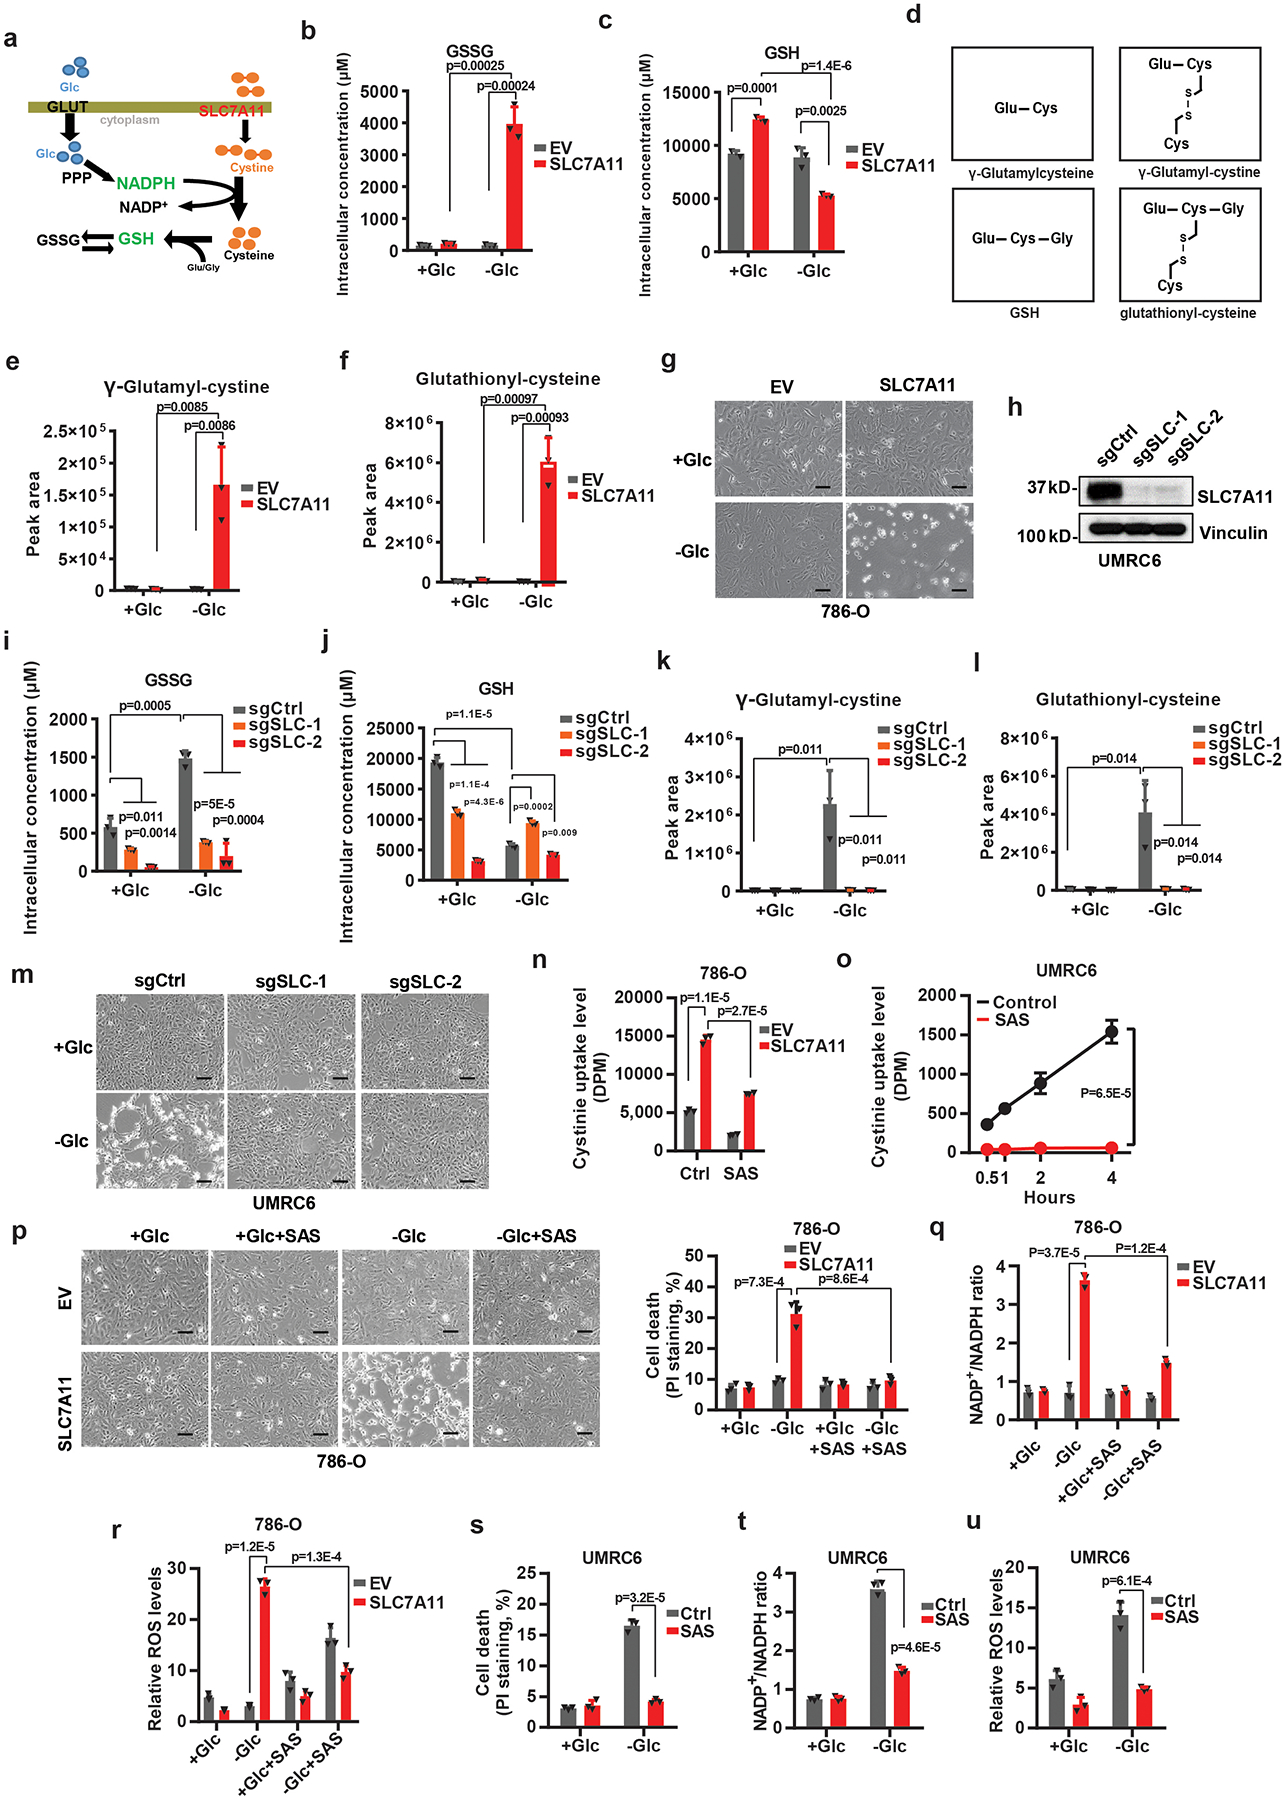
a, Simplified schematic of how SLC7A11 can be linked to NADPH and the PPP. b, c, Measurement of intracellular GSSG (b) and GSH (c) concentrations in EV and SLC7A11-overexpressing 786-O cells cultured with (+Glc) or without glucose (-Glc). d, Diagrams illustrating the structures of γ-glutamylcysteine, γ-glutamyl-cystine, GSH, and glutathionyl-cysteine. Glu: glutamate; Gly: glycine; Cys: cysteine. e, f, The relative levels of intracellular γ-glutamyl-cystine (e) and glutathionyl-cysteine (f) in EV and SLC7A11-overexpressing 786-O cells cultured with (+Glc) or without glucose (-Glc). g, Representative phase-contrast images of indicated cells cultured with or without glucose. h, Western blotting analysis of SLC7A11 protein levels in the control (sgCtrl) and SLC7A11 knockout (sgSLC-1/2) UMRC6 cells. i-l, Measurement of intracellular GSSG (i) and GSH (j) concentrations and the relative levels of intracellular γ-glutamyl-cystine (k) and glutathionyl-cysteine (l) in control (sgCtrl) and SLC7A11 knockout (sgSLC-1/2) UMRC6 cells cultured with (+Glc) or without glucose (-Glc). m, Representative phase-contrast images of indicated cells cultured with (+Glc) or without glucose (-Glc). n, o, Cystine uptake levels in EV and SLC7A11- overexpressing 786-O cells (n) or UMRC6 cells (o) upon treatment with 1 mM sulfasalazine (SAS). p-u, Cell death with or without representative phase-contrast images (p, s), NADP+/NADPH ratios (q, t), and ROS levels (r, u) of EV and SLC7A11- overexpressing 786-O or UMRC6 cells cultured in glucose-containing or glucose free medium with or without treatment of 1 mM SAS. Error bars are mean ± s.d, all bar graphs have 3 independent repeats. All scale bars=100 μm. The experiment (g, h, m, p) was repeated twice, independently, with similar results. All p values were calculated using two-tailed unpaired Student’s t-test. Scanned images of unprocessed blots are shown in Source Data Extended Data Fig. 3. Numeral data are provided in Statistics Source Data Extended Data Fig. 3.