
Fig. 4. Tissue-specific expression and subcellular localization of CYP72A9.
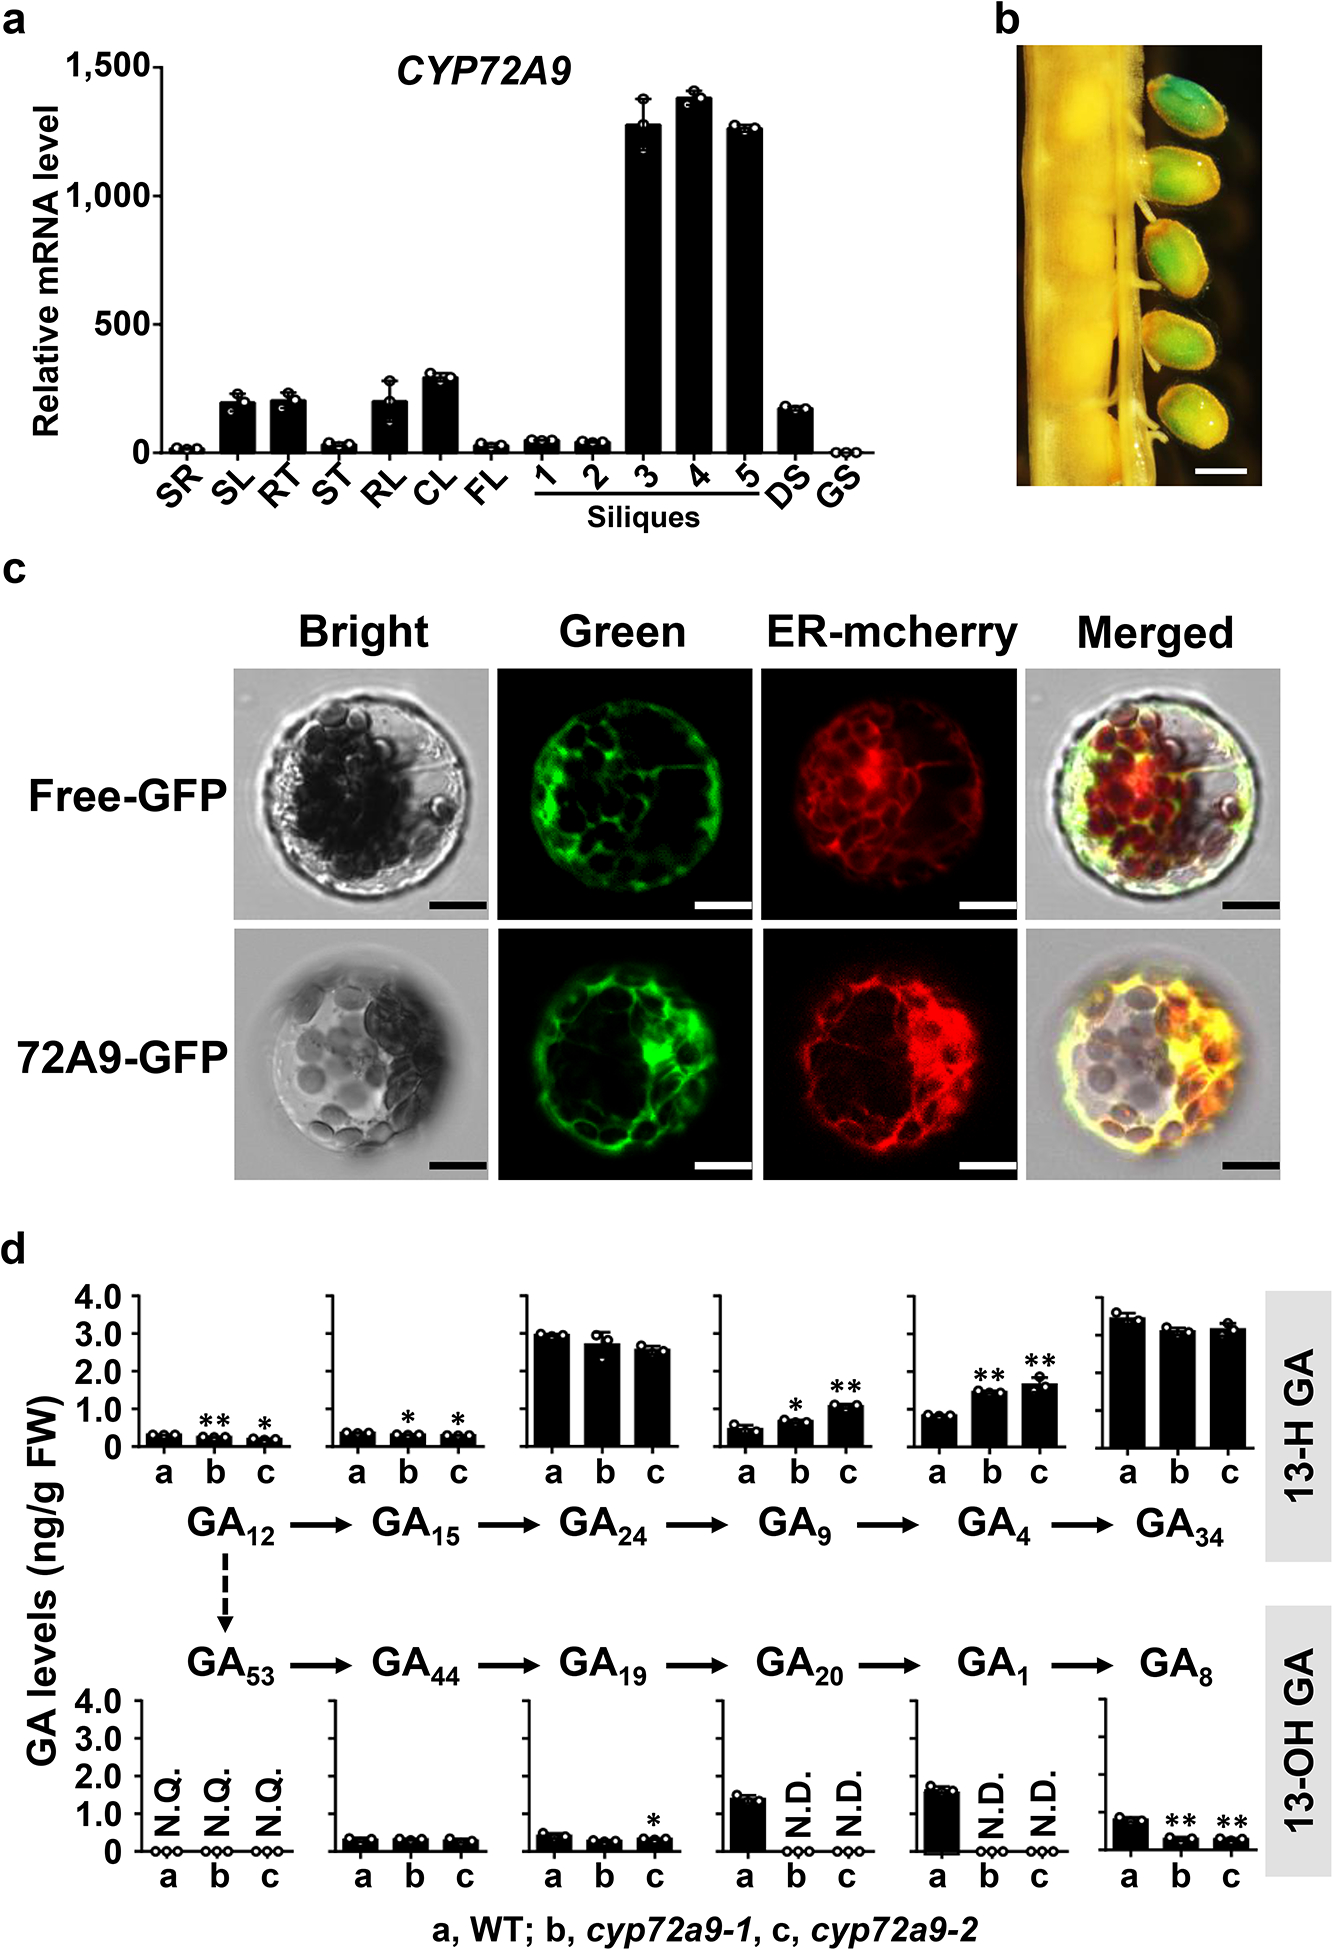
a. qRT-PCR analysis of CYP72A9 transcript levels in different tissues. Error bars represent the SD of three independent experiments. SR, root of 10-day-old seedlings; SL, leaf of 10-day-old seedlings; RO, root of mature plants; RL, rosette leaf; CL, cauline leaf; FL, flowers; GS, germinating seeds; DS, dry seeds; Silique samples were prepared followed the reference by Varbanova et al8. At1g13320, At2g28390, and At4g34270 were used as reference genes in this analysis. The lowest level of CYP72A9 transcript in germinating seeds was set as 1.0.
b. Histochemical GUS staining of siliques (stages 9 and 10) from Pro72A9:GUS transgenic plants. Scale bar = 0.2 mm. Silique samples had been stained for 24 h before imaging. This experiment was repeated two times with similar results.
c. Subcellular localization of CYP72A9 in Arabidopsis leaf-mesophyll protoplasts. The ER was revealed by mCherry marker protein (Nelson et al., 2007). Scale bar = 5 μm. This experiment was repeated two times with similar results.
d. Profiles of endogenous GAs in WT and two independent cyp72a9 mutants. The GA levels in the developing seeds/siliques of mature Arabidopsis are presented as the means ± SDs (n = 3 biologically independent samples). **, significant difference from WT (P < 0.01; two-tailed Student’s t-test); *, (P < 0.05; two-tailed Student’s t-test). N.D., not detectable; N.Q., detected, but not quantifiable due to low abundance.