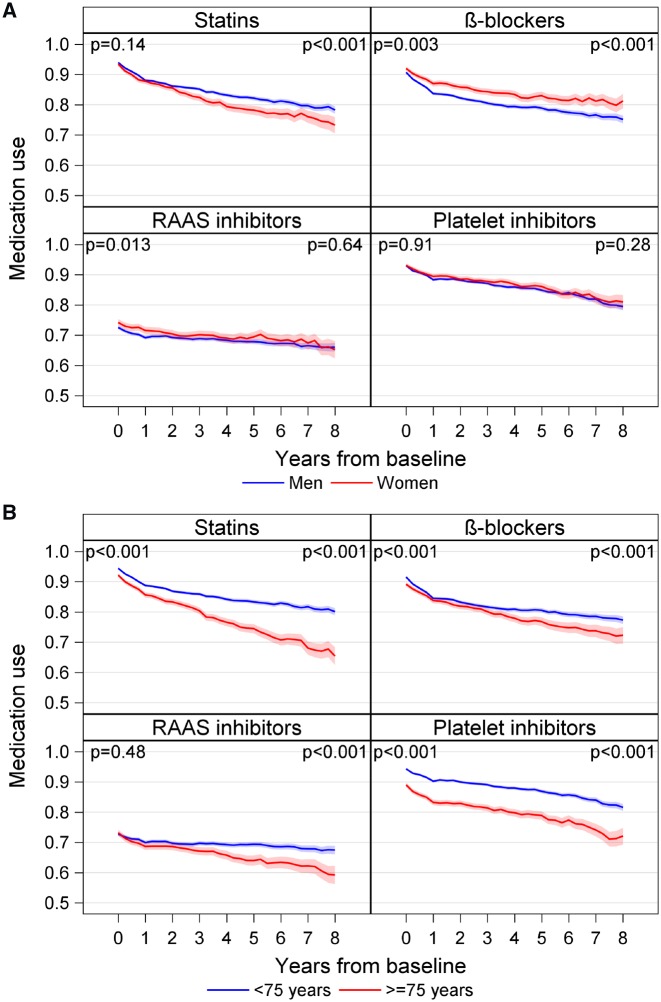
Figure 2.
Graphs showing percentage of patients with dispensed prescriptions over time grouped by: (A) sex and (B) age category. Shaded area represents 95% confidence intervals based on binomial distribution, P-values are obtained from the Fisher’s exact test for proportion of patients using secondary prevention medications between men and women, and patients <75 and ≥75 years old, respectively, at baseline and 8 years. RAAS, renin-angiotensin-aldosterone system.

