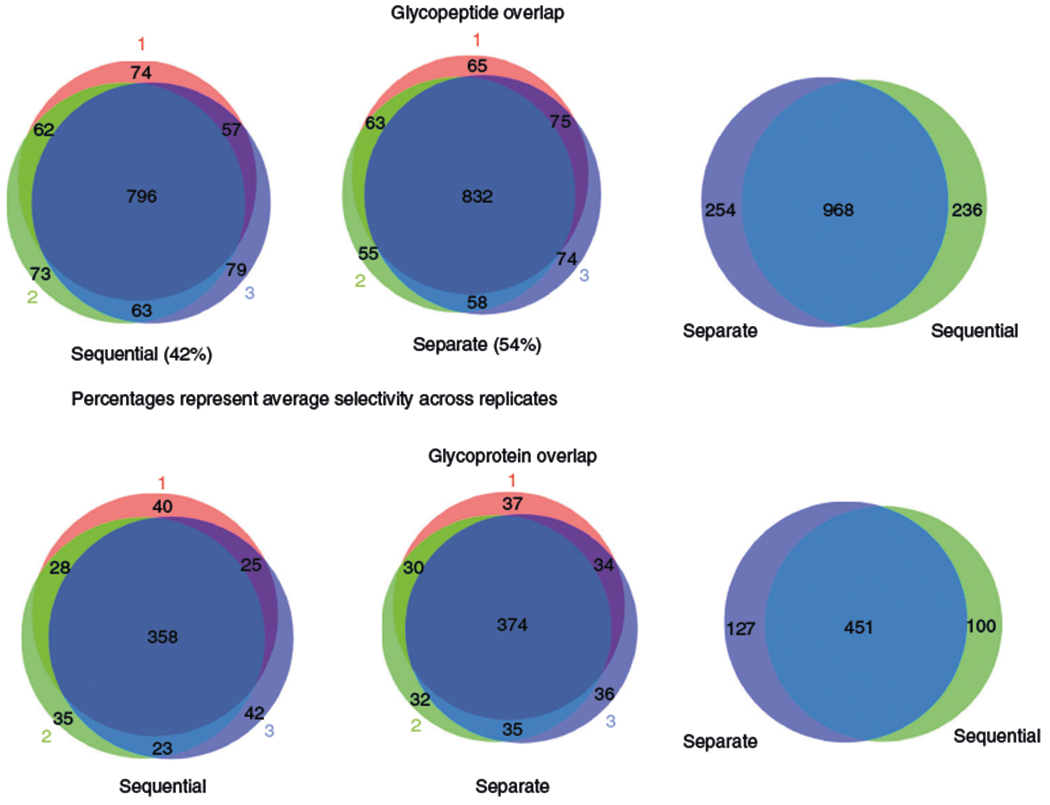
Fig. 4 |. Venn diagrams showing the glycopeptide and glycoprotein overlap between replicates and the overlap between the separate and sequential workflows.

The overlaps between replicates are shown at the glycoprotein and glycopeptide level (left-hand and center diagrams). Selectivity across replicates and the overlap between the results obtained from the separate workflows and the sequential workflows (right-hand diagrams) are depicted.
