
Fig. 5 |. Quantitation results from MaxQuant and Perseus showing Pearson correlations across each condition and replicate.
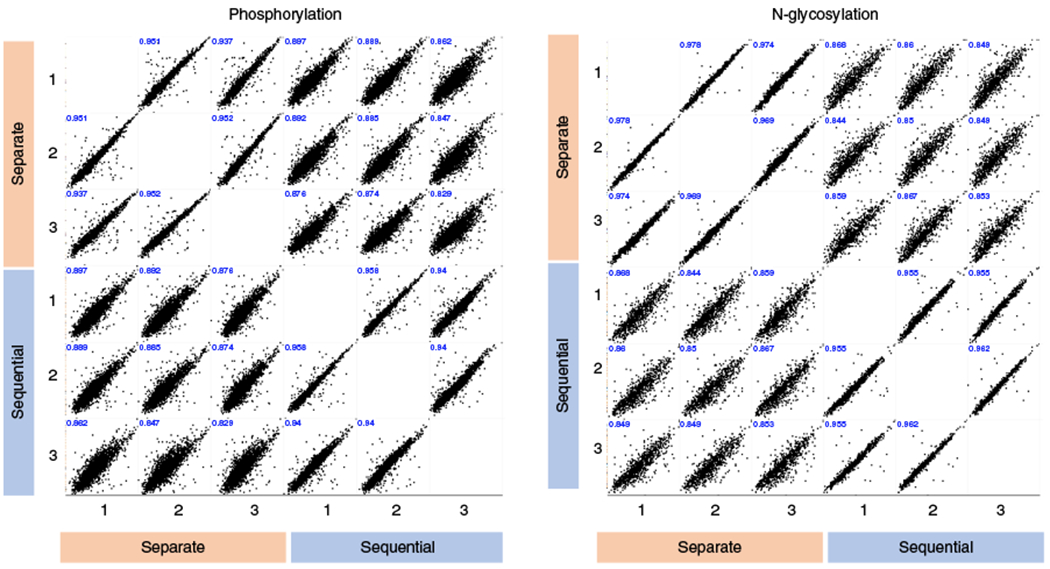
Scatterplots and Pearson correlation coefficients depicting the log2-tranformed intensities of phosphopeptides and glycopeptides across both workflows (sequential versus separate) and three technical replicates.