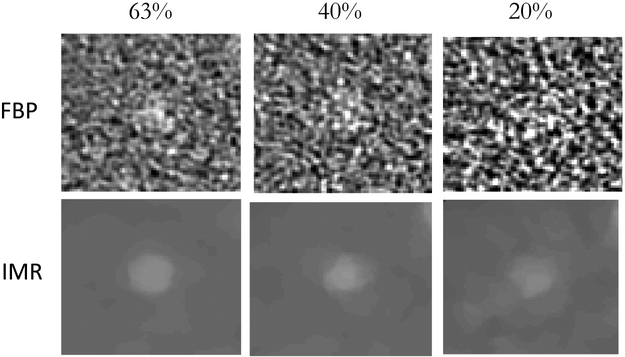
Figure 2. FBP and IMR sample images from dose experiment.
Signal images are shown with dose decreasing from left to right from 63% to 20% dose with (Top) FBP reconstruction and (Bottom) IMR reconstruction. Noise becomes more aggressive as dose is reduced. Note the drastic difference in noise characteristics between FBP and IMR reconstructed images.

