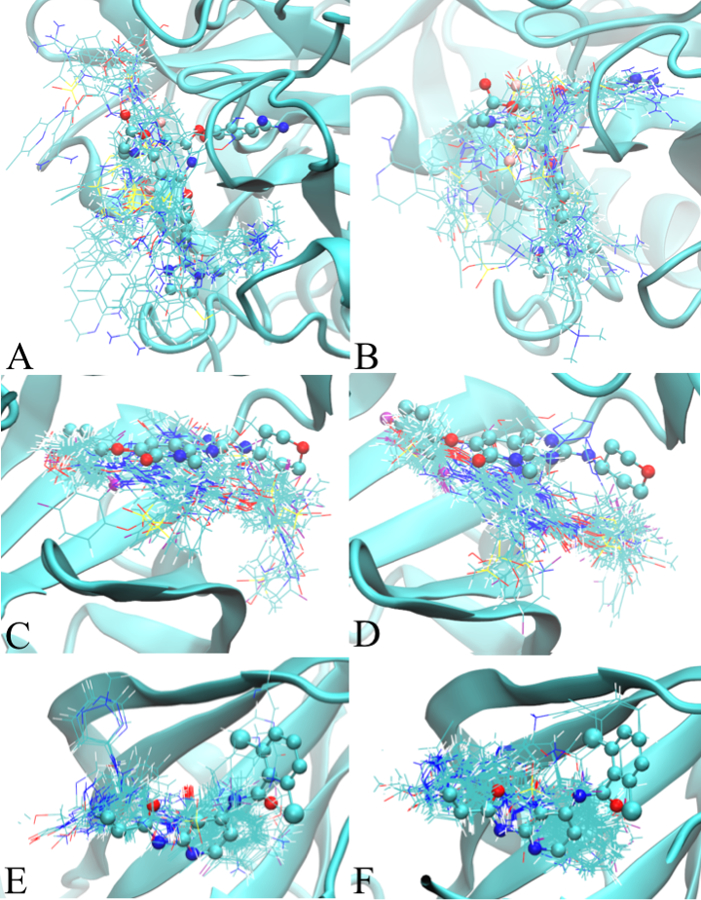
Figure 2:

Ligand minimum LGFE conformations from the Exhaustive SILCS-MC protocol for targeted proteins. The left (A, C, and E) and right (B, D, and F) panels shows the ligand conformations obtained from the additive and Drude SILCS-MC docking, respectively. Figures A/B, C/D, and E/F represent Factor Xa, P38, and TYK2, respectively. The crystallographic position of the ligand from the crystal structures are displayed in CPK model to show the location of the binding pocket. 2D images of the ligands are shown in Figure S1 of the supporting information.
