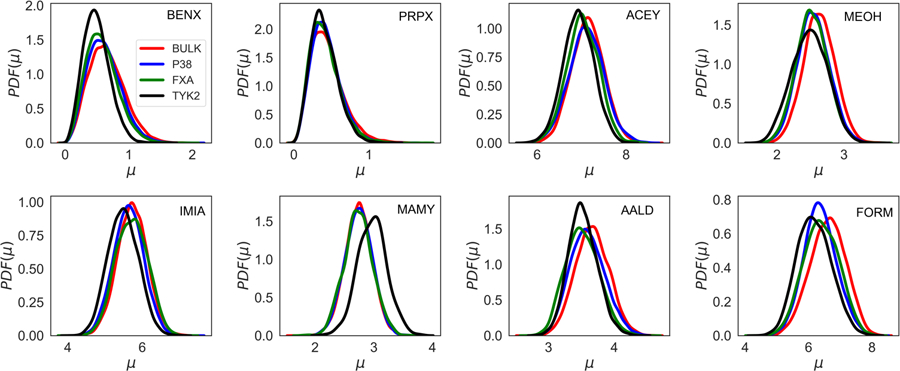
Figure 4:

Total Dipole moment distribution obtained from the Drude simulations for all the eight solutes from the P38, Factor Xa, and TYK2 protein simulations. The red color shows the dipole moment for the solute in the bulk phase and the blue, green, and black color represents dipole moment in the ligand binding pocket of P38, Factor Xa, and TYK2 protein, respectively. The BENX, PRPX, ACEY, MEOH, IMIA, MAMY, AALD and FORM represents solutes for benzene, propane, acetate, methanol, imidazole, methylammonium, acetaldehyde, and formamide, respectively.
