
Figure 3. eIF4A Limits RNA Recruitment to SGs.
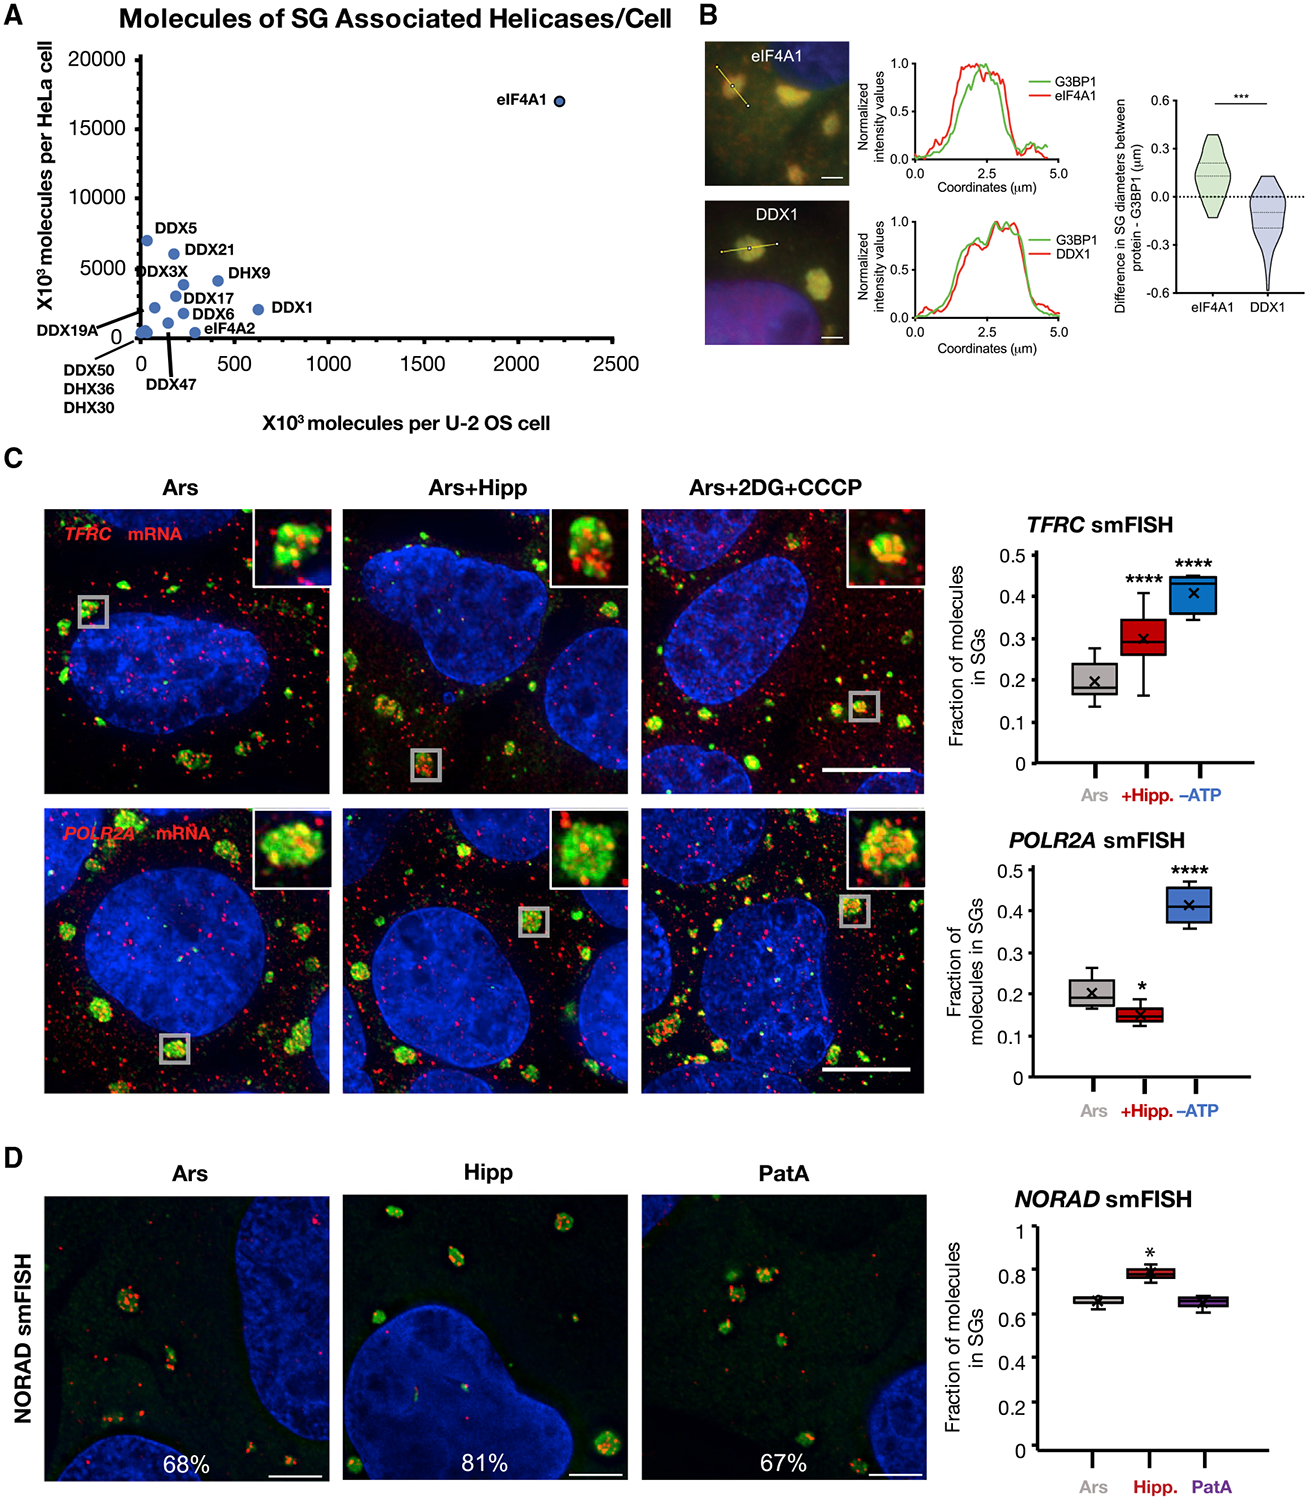
(A) Scatterplot of SG-associated helicase abundance in U2OS versus HeLa cells.
(B) IF of eIF4A1 in SGs. eIF4A1 extends past the SG periphery as compared to DDX1, which co-extends with G3BP1. Scale bars, 2 μm. n = 3 replicates.
(C) smFISH images and quantification of SG enrichment for TFRC and POLR2A mRNAs in U2OS cells treated with 60 min arsenite, then 30 min DMSO, Hipp, or 2DG and CCCP. Gray boxes denote the SGs in the insets. SGs are visualized by anti-PABPC1 IF. Scale bars, 20 μm. n ≥ 5 frames per condition. x represents the mean in our quantifications.
(D) NORAD lncRNA smFISH images and quantification in U2OS cells treated with arsenite, Hipp, or PatA. SGs are visualized by anti-G3BP1 IF. Scale bars, 5 μm. n = 3 replicates. *p < 0.05, **p < 0.01, ***p < 10−3, ****p < 10−4. x represents the mean in our quantifications.
See also Figure S3.