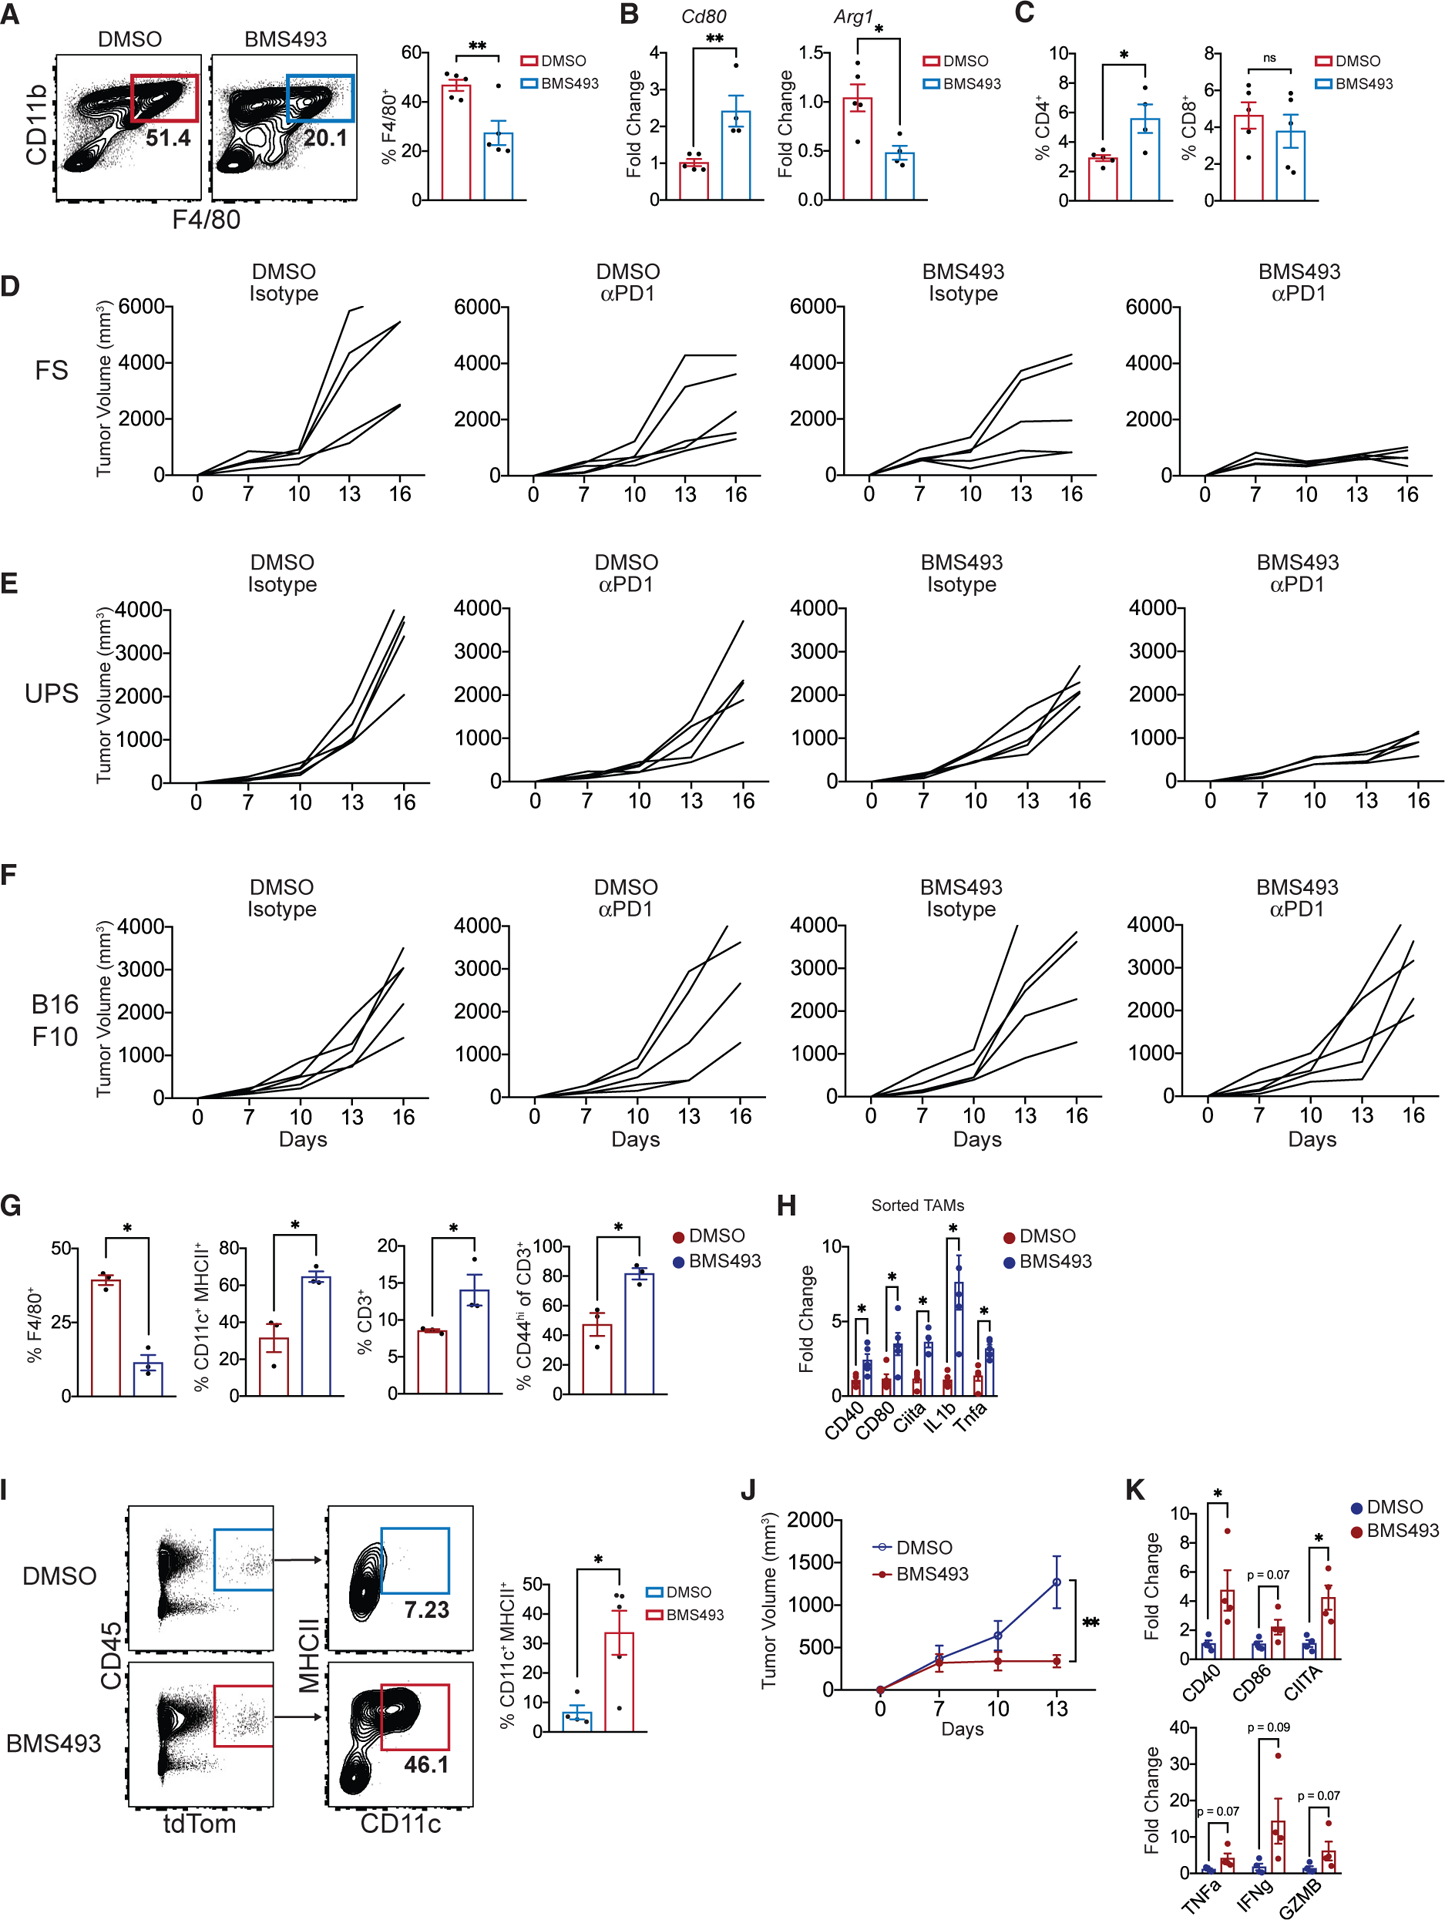
Figure 6. Intratumoral RAR Signaling Inhibition Engenders Stimulatory APCs and Synergizes with PD-1 Blockade.

(A) Frequency of CD11b+ F4/80+ TAMs in FS tumors treated with BMS493 or DMSO. Three doses (200 mg, intratumorally) at days 7, 10, and 13 (n = 5 tumors per group, harvested 15 days post-transplant).
(B) Cd80 and Arg1 expression (qPCR) in FS tumors treated with intratumoral BMS493 or DMSO (n = 5 tumors per group).
(C) Frequencies of CD4+ or CD8+ T cells within CD45+ leukocytes in FS tumors treated with intratumoral BMS493 or DMSO (n = 5 tumors per group).
(D–F) Individual growth curves of FS (D), UPS (E), and B16-F10 melanoma (F) tumors treated with αPD1 (or isotype control) in combination with intratumoralBMS493 (or DMSO). BMS493 (200 mg intratumorally) and/or αPD1 (200 mg i.p.) were administered at days 7, 10, and 13 (n = 5 tumors per group).
(G) Mice with established SS tumors (autochthonous model) were treated with DMSO or BMS493 i.p. (3 doses of 200 mg at days 1, 3, and 5; mice euthanized on day 7). Shown are frequencies of specified myeloid and lymphoid populations in SS tumors (n = 3 per group).
(H) Relative expression of Cd40, Cd80, Ciita, Il1b, and Tnfa in sorted TAMs from DMSO- or BMS493-treated SS tumors (n = 3 per group).
(I) Monocytes from bone marrow of Lyz2Cre: Rosa26tdT mice were treated with either DMSO or BMS493 (1 mM) for 1 h and washed twice in PBS. Subsequently, 5 × 10⁵ monocytes were injected directly into FS flank tumors (three injections; 7 days, 9 days, and 11 days post- transplant). FCM plots of tdT+ cells (derived from transplanted monocytes) and frequencies of CD11c+ MHCII+ within the tdT+ fraction at 13 days post-tumor implantation.
(J) Growth of FS tumors injected with DMSO- or BMS493-treated monocytes. Tumor volume was measured every 3days starting at 7 days post-implantation (n = 4 tumors per group, representative of three independent experiments).
(K) Relative expression of Cd40, Cd86, Ciita, Tnfa, Ifng, and Gzmb in bulk FS tumors transplanted with either DMSO- or BMS493-treated monocytes. Normalized to Hprt expression.
*p < 0.05, **p < 0.01, ***p < 0.001. Two-tailed t test. (J) was analyzed with linear mixed-effects modeling with Tukey’s HSD post-test. All error bars represent SEM. Events shown in FCM plots are pregated on live singlets unless otherwise specified and numbers represent percentage of cells within indicated gates.
See also Figure S6.
