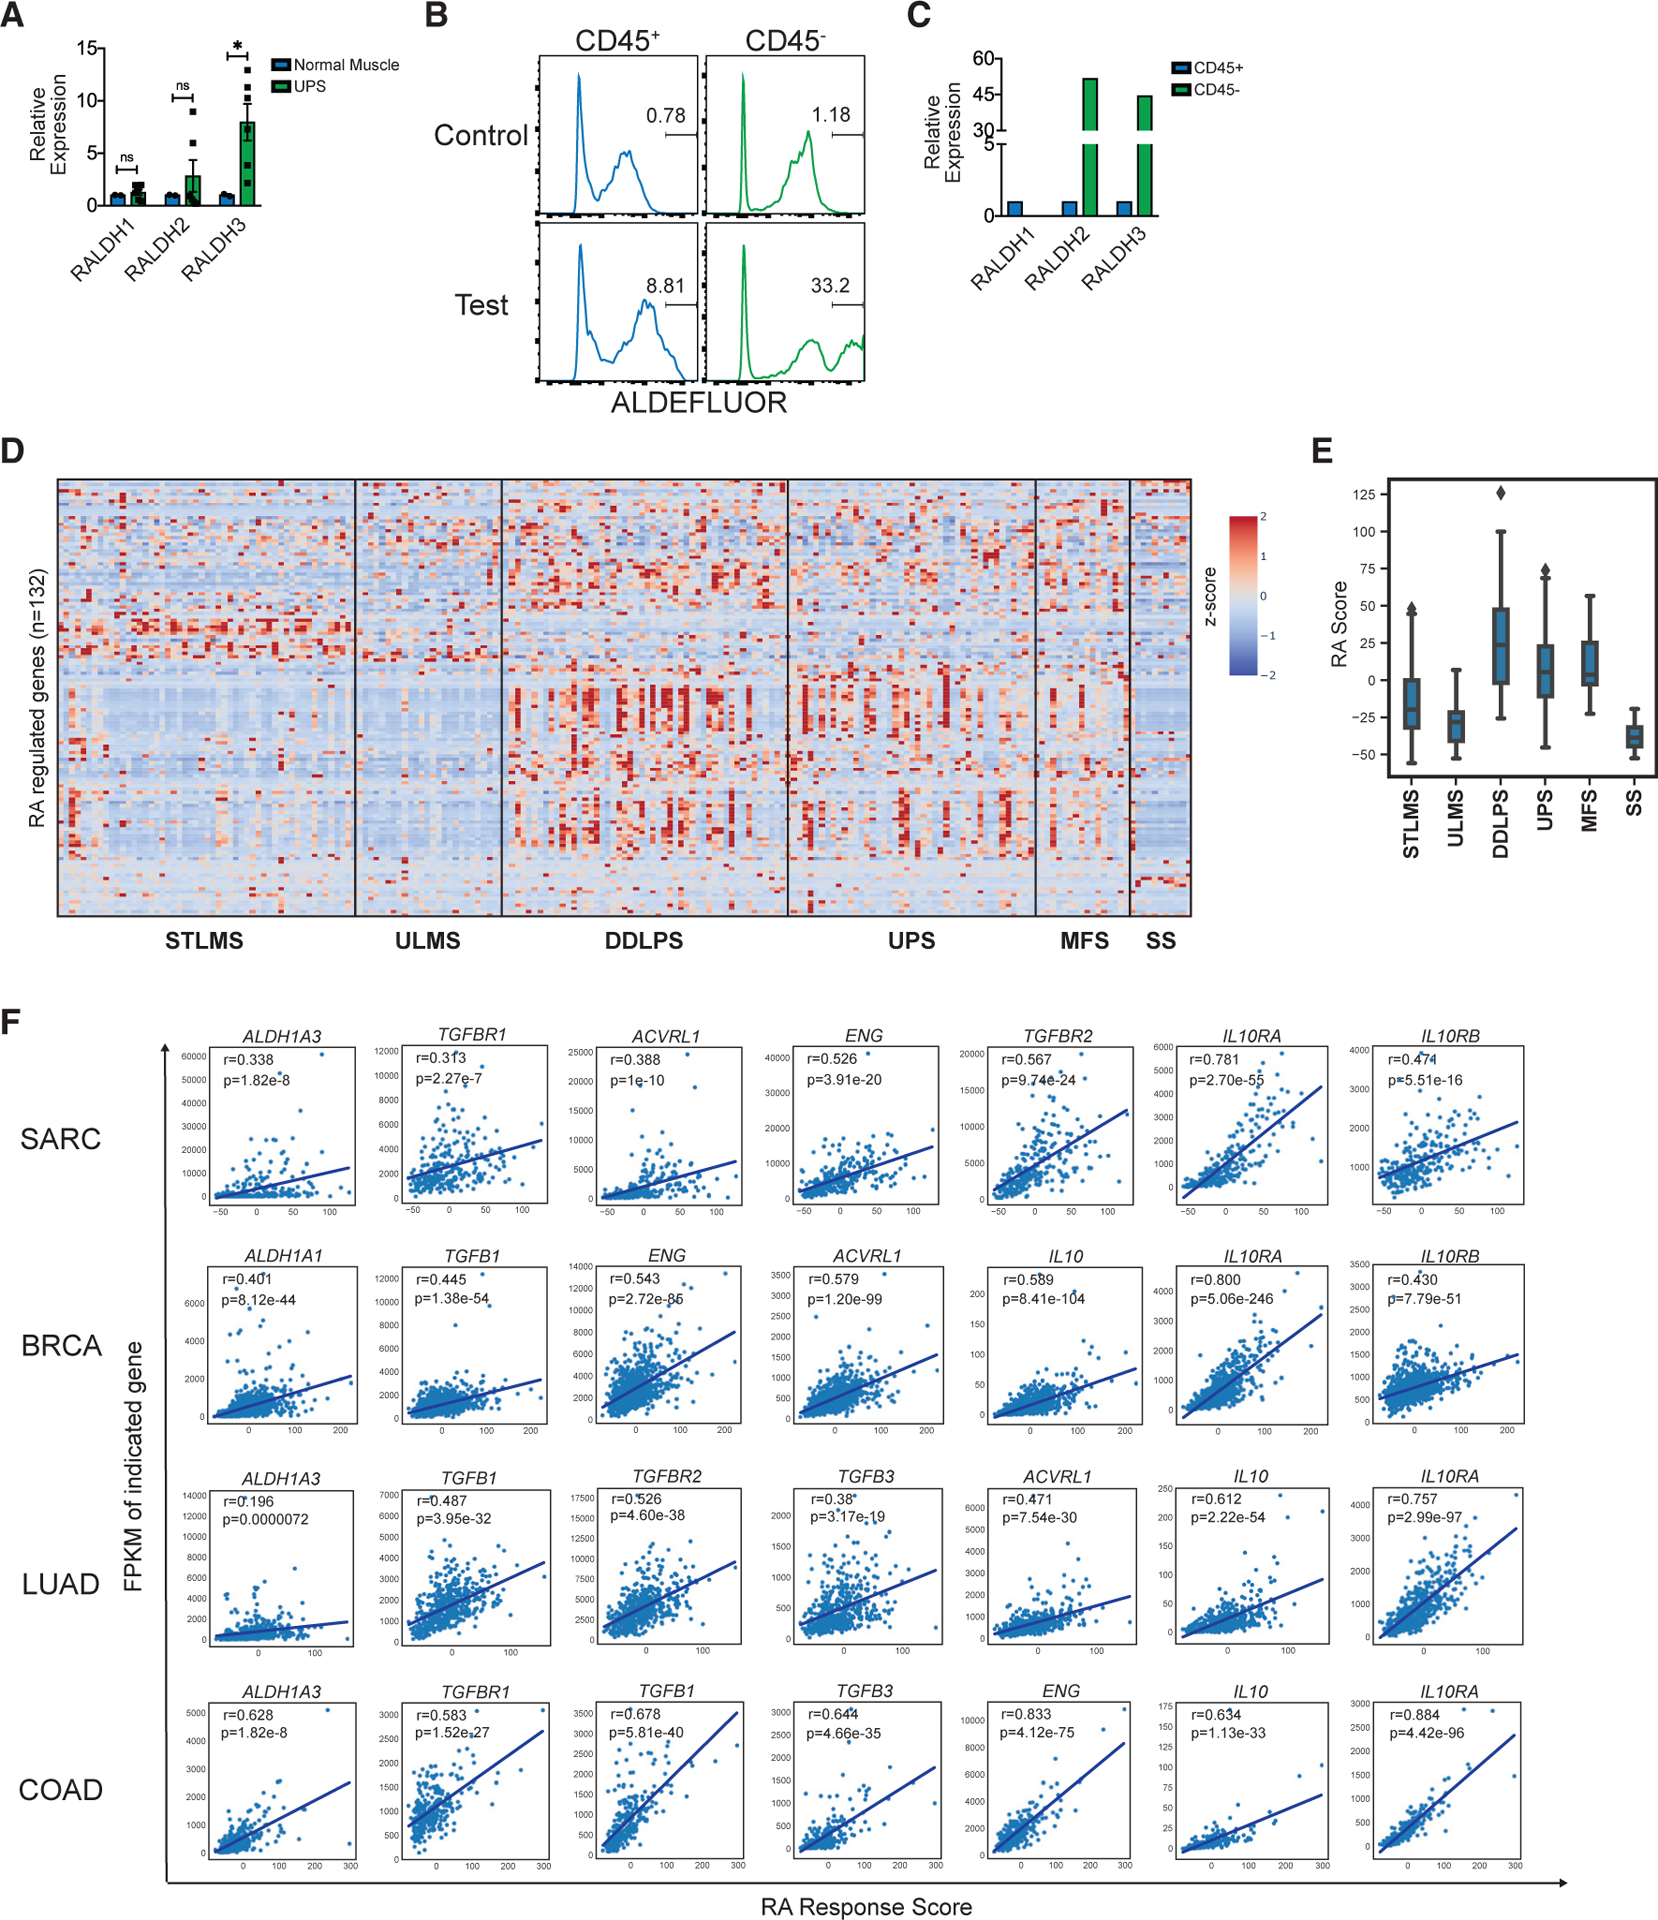
Figure 7. Monocyte RA-Responsive Gene Signature Correlates with an Immunosuppressive TME in Human Cancer.

(A) RALDH1, RALDH2, and RALDH3 expression (qPCR) in human UPS compared to human skeletal muscle. Each dot represents tissue sampled from a different location of tumor (two tissue samples from n = 3 tumors).
(B) ALDEFLUOR assay on human UPS. Shown are histograms of “control” and “test” samples pregated on CD45+ (left) or CD45− cells (right). Representative of 2 human UPS.
(C) Relative expression of RALDH1, RALDH2, and RALDH3 (qPCR) in sorted CD45+ compared to CD45− cells from human synovial sarcoma (SS). Representative of 2 human SS. Normalized to Hprt.
(D) Heatmap of Z scores of human monocyte RA regulated genes (n = 132; y axis) for each tumor sample (n = 259; x axis) in TCGA SARC (sarcoma) dataset. SARC dataset was further subcategorized into soft tissue leiomyosarcoma (STLMS), uterine leiomyosarcoma (ULMS), dedifferentiated liposarcoma (DDLPS), undifferentiated pleomorphic sarcoma (UPS), myxofibrosarcoma (MFS), and synovial sarcoma (SS). Human monocyte RA regulated gene list was obtained by analyzing microarray data of human monocytes cultured with GM-CSF and IL-4 treated with RA (20 nM) versus DMSO. The names of individual genes on the y axis have been listed in Figure S7. Additional details in Figure S7 and STAR Methods.
(E) Boxplots of “RA response score” for samples in SARC TCGA dataset (grouped as described in D). “RA response score” for each tumor sample was calculated by summing over the Z score for all RA-regulated genes.
(F) “RA response score” plotted against fragments per kilobase of exon model per million reads mapped (FPKM) values for each tumor sample for the indicated genes. Pearson’s correlation analysis to determine r and p values. BRCA, breast invasive carcinoma; LUAD, lung adenocarcinoma; COAD, colon adenocarcinoma. The individual p value for each correlation is shown within each plot.
*p < 0.05. Two-tailed t test. All error bars represent SEM. Events shown in FCM plots are pregated on live singlets unless otherwise specified and numbers represent percentage of cells within indicated gates.
See also Figure S7.
