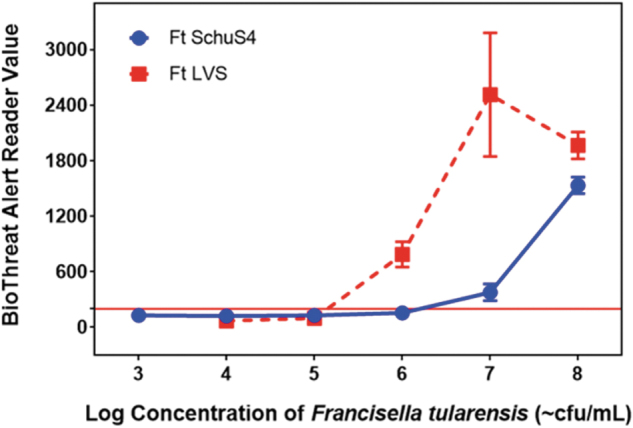
Figure 2.

Range-finding for SchuS4 and LVS Strains. These 2 curves are the titrations performed for the 2 F. tularensis strains (SchuS4 and LVS). The SchuS4 strain curve was generated with an average of 5 tests per concentration, while the LVS strain curve was generated with an average of 3 tests per concentration. The error bars are standard deviations of the BTA Reader MX values.
