Figure 2.
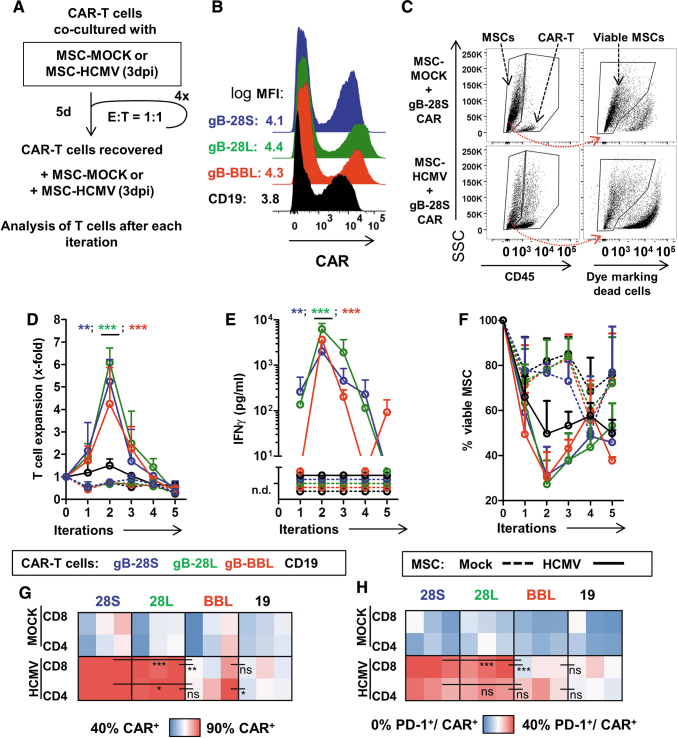
Effects of sequential cocultures of CAR-T cells with MSCs infected with HCMV. (A) Schematic illustration of the sequential coculture assay. CAR-T cells were cocultured with MSCs noninfected (MOCK) or infected with HCMV/GLuc (HCMV) at E:T 1:1 for 5 days. The expanded T cells were recovered, counted, and reincubated with fresh target cells for additional four cycles. Triplicate experiments were performed using one AB T cell source for generation of CAR-T cells, and MSCs expanded from three different donors. (B) Flow cytometric detection of CAR+ T cells (19: black; 28S: blue; 28L: green; BBL: red). (C) Flow cytometry approach to distinguish CD45+ T cells and CD45− MSCs and then staining with the viability dye FVD eFluor450 to detect viable MSCs. Representative examples show cocultures of 28S CAR-T cells with MSCs. (D) Expansion of the CAR-T cells of different types upon culture with MSCs was determined by flow cytometry using counting beads as reference. Asterisks indicate differences between cocultures with HCMV-infected MSCs comparing gB-CARs (indicated by asterisk color) to CD19-CAR by two-way ANOVA and Bonferroni's post hoc test. (E) Coculture supernatants were analyzed by ELISA for detection of IFN-γ. (F) Quantification of viable MSCs after iterations. (D–F) Dots represent mean ± SD (n = 3 measured for each MSC source). (G) Heat map representing frequency of CAR+ cells measured for CD4+ or CD8+ T cells after the last iteration (lowest 40% blue, to highest 90% red). Each square depicts one experimental replicate (n = 3 in total per coculture). (H) Heat map representing frequency of PD-1+ on CAR+/CD4+ or CAR+/CD8+ T cells (lowest 0% blue, to highest 40% red). Differences were analyzed by two-way ANOVA and Bonferroni's post hoc test. (D–H) *p ≤ 0.05, **p ≤ 0.01, ***p ≤ 0.001. For detailed statistical analysis see Table 2. See Supplementary Figure S4 for gating strategies. MFI, mean fluorescence intensity; ns, not significant (p > 0.05). Color images are available online.

