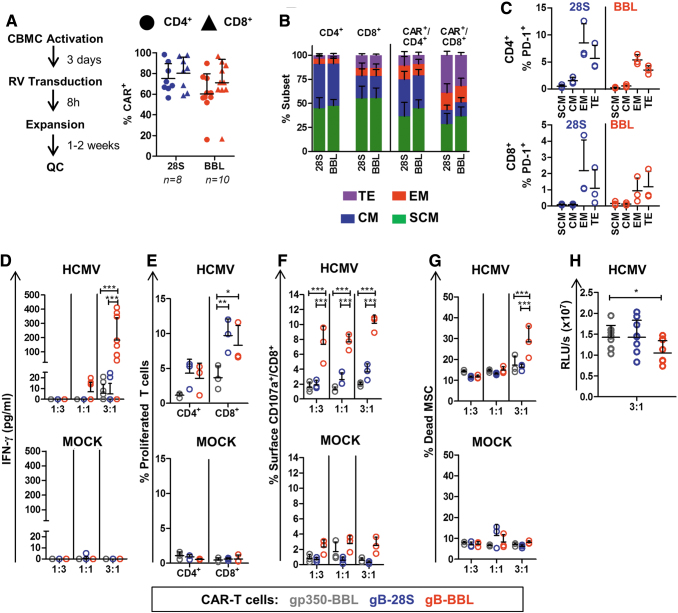
Figure 3.
Generation of CAR-T cells with CB cells and functionality testing. (A) Left panel: Schematic representation of CAR-T cell production using CB units. After transduction of mononuclear cells with vectors expressing 28S- or BBL-CAR, the frequencies of CD4+ CAR+ (circles) and CD8+ CAR+ (triangles) T cells were analyzed. The numbers of transduction runs are indicated, symbols represent each run and bars represent mean ± SD (see Supplementary Fig. S1 A for gating strategy). (B) 28S- and BBL-gB-CAR-T cells were produced using three different CB donations. The T cell subtypes for total CD4+ or CD8+ CAR+ T cells and CD4+ CAR+ and CD8+ CAR+ T cells were quantified by flow cytometry (Gating strategy: Supplementary Fig. S5): TE (CD45RA+/CD62L, purple), EM (CD45RA−/CD62L−, red), CM (CD45RA−/CD62L+, blue), SCM (CD45RA+/CD62L+, green). (C) Frequencies of PD-1+ cells detectable for CD4+ or CD8+ T cells for each subtype for 28S- (blue) or BBL-CAR-T cells (red). (D–H) CAR-T cells (gp350: gray; 28S: blue; BBL: red) generated with CB mononuclear cells were cocultured with MSCs infected with HCMV/GLuc (HCMV) or noninfected (MOCK, lower panels). (D) Cell were cocultured for 3 days at E:T ratios of 1:3; 1:1; and 3:1. Supernatants were collected after coculture and the concentration of IFN-γ in the medium was measured by ELISA. (E) CD4+ and CD8+ T cell proliferation quantified for the 3:1 (E:T) cocultures as the percentage of cells showing loss of the labeling dye CellTrace. (F) Degranulation was detected by detection of the CD107a cell surface marker on CD8+ T cells by flow cytometry analyses. (G) Dead MSCs were quantified as frequency of CD45− cells incorporating the viability dye eFluor450. (H) Detection of bioluminescence in coculture supernatants (E:T 3:1), which was correlated with the persistence of HCMV/GLuc infection in MSCs. Data shown as RLUs. Results obtained with three independent experiments with triplicate cocultures for each experiment using CAR-T cells generated from three different CB units are shown. Triplicate cultures were pooled for flow cytometry analyses shown in (E–G). See Supplementary Figure S3 for detailed gating strategies. Statistical differences were evaluated by two-way ANOVA and Bonferroni's post hoc test (D–G) or by one-way ANOVA and Dunnett's post hoc test (H). Symbols represent individual replicates and bars represent mean ± SD. For detailed statistical analysis see Table 1. *p ≤ 0.05, **p ≤ 0.01, ***p ≤ 0.001. CB, cord blood; CM, central memory; EM, effector memory; SCM, stem cell memory; TE, terminal effector. Color images are available online.

