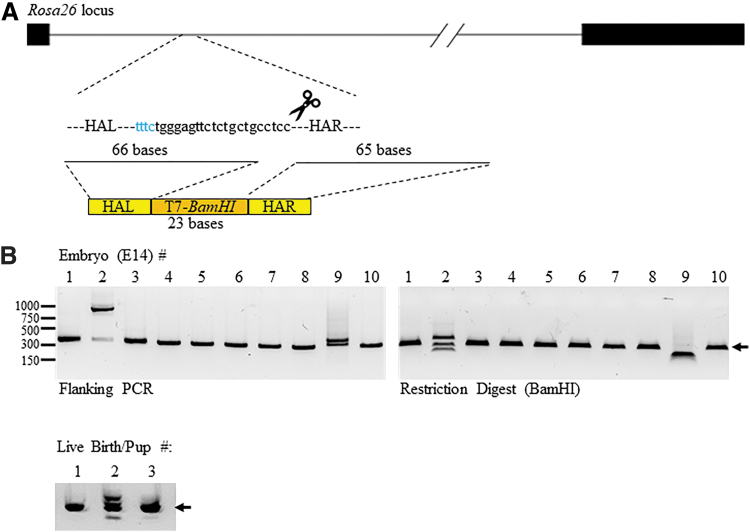
FIG. 3.
Mouse Rosa26 target with oligo donor integrations. (A) Schematic representation of the Rosa26 locus and the targeting gRNA. Dark bars represent exons and the solid line intron 1. The blue text represents the protospacer adjacent motif site and the remaining targeting sequence. The size of the homology arms (HA; bases) within the oligo donor is listed and the lines represent where it starts within the target region. The bottom schematic represents the HA (R, right; L, left) in yellow and the T7-BamHI integration sequence in orange. (B) PCR amplification products that flank the Rosa26 locus from purified DNA of isolated oligo-donor micro-injected embryonic day 14 (E14) embryos (left panel), BamHI restriction digests of the amplification products (right panel), and PCR amplification products for live-born pups (bottom panel). The dark arrow on the right of each gel represents the expected size (302 bp) of the PCR amplification product. The numbers to the left represent the location of the DNA size markers in base pairs.

