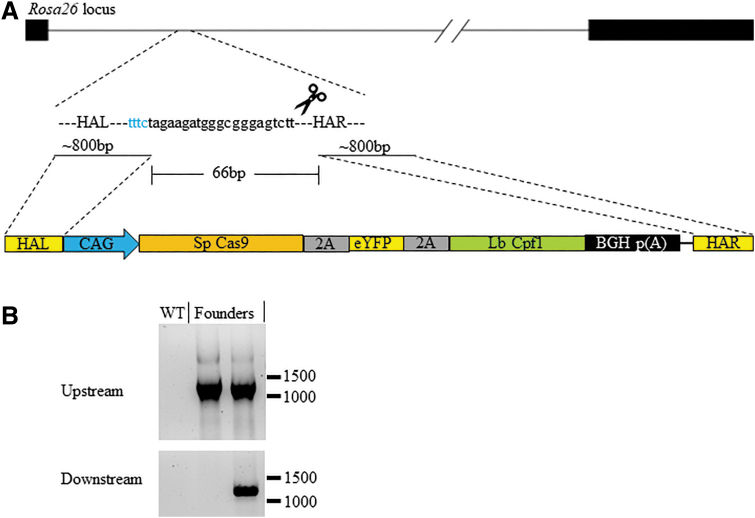
FIG. 4.
Mouse Rosa26 target with large plasmid donor integrations. (A) Schematic representation of the Rosa26 locus, targeting gRNA and the large targeting donor plasmid. The size of the HA within the plasmid donor and the lines to where they start within the target region. The middle 66 bp listed represents the distance between where the HA start within the Rosa26 locus. The bottom schematic represents the HA (R, right; L, left) in yellow, CAG promoter in blue, poly(A) signal in black, and the remaining Cas9-eYFP-Cpf1 gene fusion. (B) Upstream (top panel) and downstream (bottom panel) junction PCR amplification products from purified DNA from wild-type (WT) and founder mice. The numbers on the right in each panel represent DNA size markers in base pairs.

