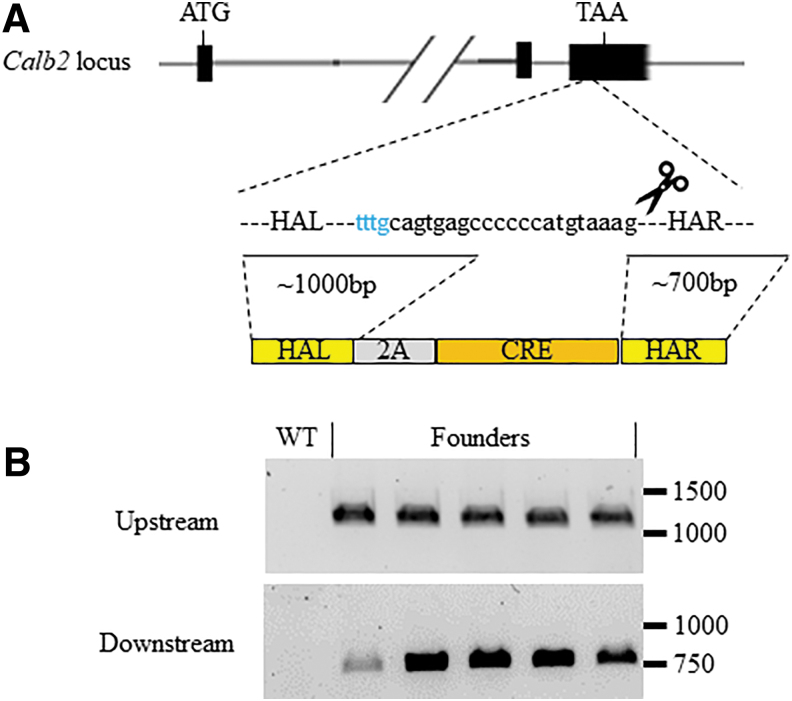
FIG. 5.
Cre targeting of the Rat Calb2 gene. (A) Schematic representation of the Calb2 locus, targeting gRNA and the Cre-targeting donor plasmid. The locations of start (ATG) and stop (TAA) codons are listed above and the dotted lines to where the targeting vector will integrate upstream of the stop codon. The Calb2 locus is shortened for simplicity and to include the relevant exons for Cre-targeting. The size of the HA within the plasmid donor and the lines to where they start within the target region. The bottom schematic represents the HA (R, right; L, left) in yellow and the Cre gene in orange. (B) Upstream (top panel) and downstream (bottom panel) junction PCR amplification products from purified DNA from WT and founder rats. The numbers on the right in each panel represent DNA size markers in base pairs.

