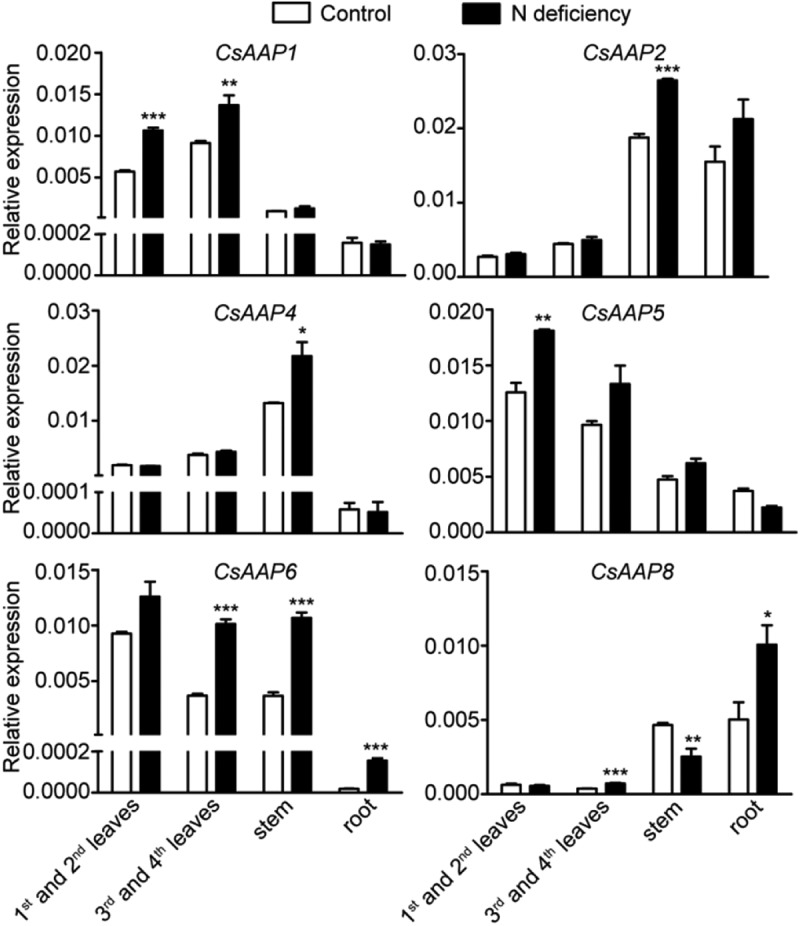
Figure 2.

CsAAP expression in various tissues in response to nitrogen (n) deficiency. Results of RT-qPCR of CsAAP1, CsAAP2, CsAAP4, CsAAP5, CsAAP6 and CsAAP8 expression in first and second leaves, third and fourth leaves, tender stem and root of the tea plants under normal N supply (Control) and N deficiency conditions. Mean of three independent biological replicates of 4 plants with three technical replicates. Error bars are standard error of the mean. Asterisks represent statistical significance determined by Student’s t-test (*p = 0.05, **p = 0.01, ***p = 0.01).
