
Figure 1.
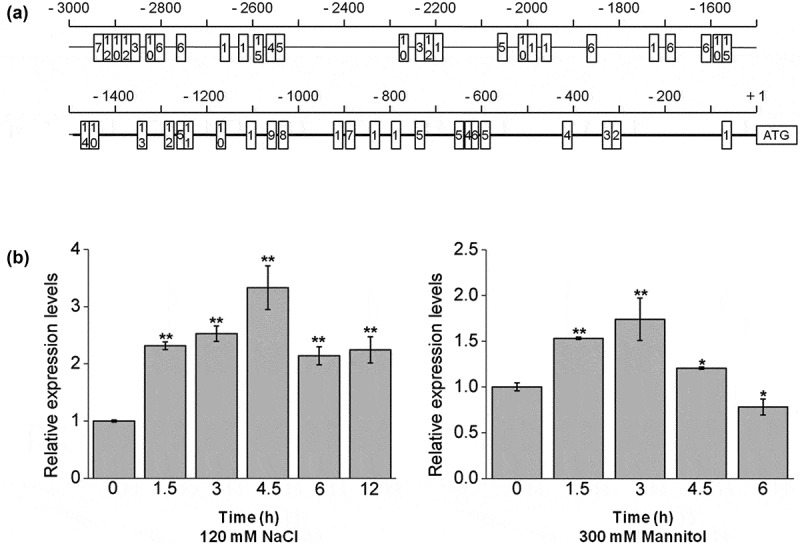
Bioinformatics analysis of the AtPPRT1 promoter and the transcriptional expression levels of AtPPRT1 under abiotic stresses. (a) The region of 3 kbp upstream of the AtPPRT1 gene was analyzed for the cis-acting elements according to the plant cis-acting regulatory element database (PlantCARE). The promoter region of 1492 bp used in this study is shown in bold line. The numbers in the boxes indicate different binding sites. 1, MYC binding-site motif; 2, ACE binding-site motif; 3, ABRE binding-site motif; 4, O2 site motif; 5, BOX4 promoter motif; 6, ARE binding-site motif; 7, LTR binding-site motif; 8, AE-box promoter motif; 9, W-box promoter motif; 10, MYB binding-site motif; 11, TGA-element; 12, G-Box promoter motif; 13, MBS binding-site motif; 14, P-box promoter motif; 15, TCA-element. (b) the qRT-PCR analysis of AtPPRT1 transcriptional expression levels induced by 120 mM NaCl and 300 mM mannitol. These experiments were repeated three times with similar results. Error bars represent ± SD (n = 3, *p < .05, **p < .01, t-test).