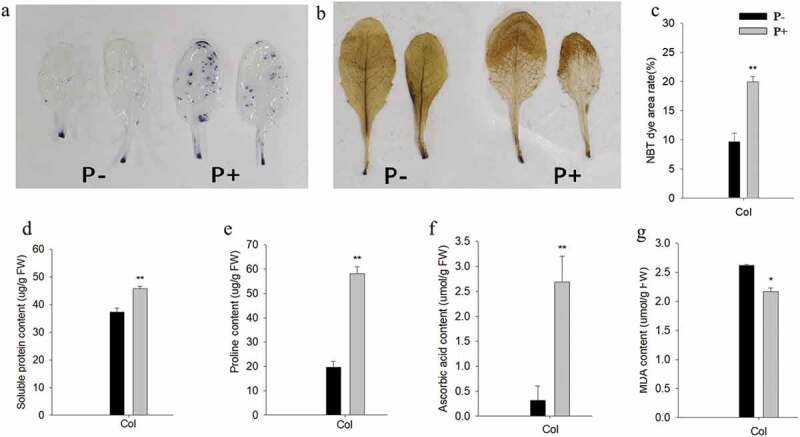
Figure 2.

Representative pictures of leaves after NBT (a) or DAB (b) staining. (c-g) quantified data for % area of leaves stained by NBT (c), and the amounts of soluble protein (d), proline (e), ascorbic acid (f), and MDA (g) in the leaves of wild-type seedlings after 12 h of post-thaw recovery period. Quantified data are means of three independent experiments ± SD. Asterisks indicate significant differences compared with the non-inoculated plants (*P < .05, **P < .01, t-test). Black (white) bars: P. indica-(un-)colonized plants.
