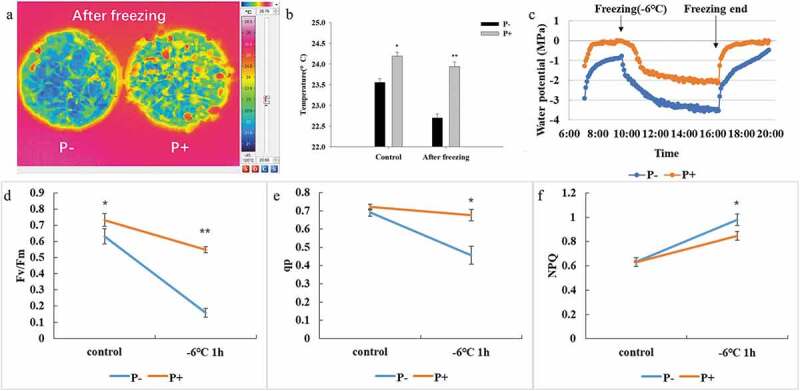
Figure 3.

Leaf temperature (a and b), water potential characteristics (c), chlorophyll fluorescence parameters (d, Fv/Fm; e,qp; f, NPQ) of Arabidopsis under freezing stress (−6°C). In b and d – f, data are means of three independent experiments ± SD. Asterisks indicate significant differences compared with the non-inoculated plants (*P < .05, **P < .01, t-test).
