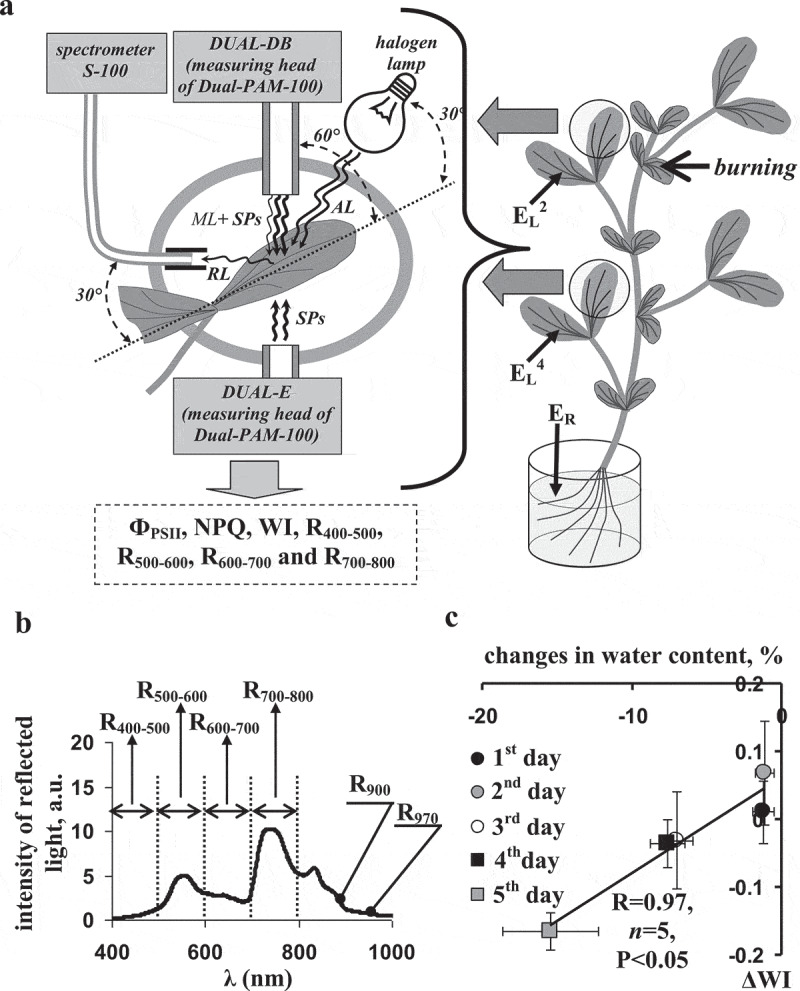
Figure 1.

(a) Schematic of plant burning, locations of electrodes, and measurements of photosynthetic and spectral parameters. EL2 and EL2 are electrodes, which were placed on the leaflet of the second and fourth leaves, respectively; ER is the reference electrode. The local burning of the first mature leaf (flame, 3–4 s, approximately 1 cm2) was used for the induction of electrical signals and physiological responses (arrow). A PAM fluorometer Dual-PAM-100, including detector block Dual-DB and emitter block Dual-E, was used for measurements of the quantum yield of photosystem II (ФPSII) and non-photochemical quenching of chlorophyll fluorescence (NPQ). A spectrometer S-100 was used for measurement of the reflected light. AL is the actinic light (halogen lamp Osram Decostar, white light, about 630 μmol m−2s−1); SPs is the saturation pulses (Dual-PAM-100, 630 nm, 10 000 μmol m−2s−1, 300 ms); ML is the measuring light (Dual-PAM-100, 460 nm, 24 μmol m−2s−1, 2.5 µs pulses); RL is the reflected light. is the water index; R900 and R970 are intensities of the reflected light at 895–905 nm and 965–975 nm; R400–500, R500–600, R600–700, and R700–800 are average intensities of the reflected light at broad spectral bands (400–500, 500–600, 600–700, and 700–800 nm, respectively). (b) A spectrum of the reflected light in the pea leaf. (c) Connection between average decrease in WI (ΔWI) and average decrease in the relative water content during soil drought (1–5 d without irrigation). ΔWI was calculated as difference between WI in experiment (under the soil drought) and WI in control; change in the water contents was calculated analogically. R is the linear correlation coefficient.
