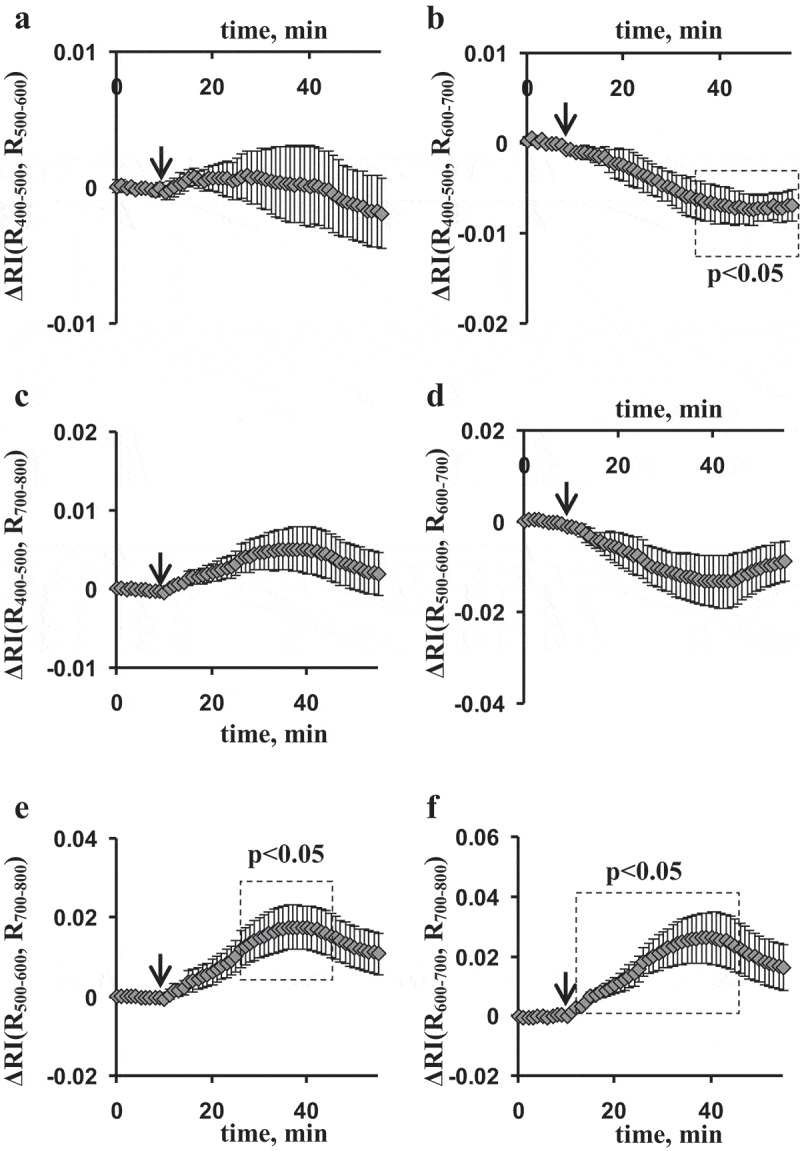
Figure 3.

Average burning-induced changes in the reflectance indices (ΔRIs), calculated on basis of broad spectral bands in the second leaf of pea seedlings (n = 6). (a) The reflectance index was calculated on basis of intensities of the reflected light (r) at 400–500 and 500–600 nm; (b) the reflectance index was calculated on basis of intensities of the reflected light at 400–500 and 600–700 nm; (c) the reflectance index was calculated on basis of intensities of the reflected light at 400–500 and 700–800 nm; (d) the reflectance index was calculated on basis of intensities of the reflected light at 500–600 and 600–700 nm; (e) the reflectance index was calculated on basis of intensities of the reflected light at 500–600 and 700–800 nm; (f) the reflectance index was calculated on basis of intensities of the reflected light at 600–700 and 700–800 nm. The local burning of the first mature leaf (flame, 3–4 s, approximately 1 cm2) was used for induction of electrical signals and physiological responses (arrow). RI(Rx, Ry) was calculated as , where Rx and Ry were average intensities of reflected light in the broad spectral bands (400–500, 500–600, 600–700, and 700–800 nm). Change in RI was calculated as difference between current value of RI and value of RI before burning. Average values and standard errors are shown in the figure. Dotted boxes show significant differences from values before stimulation (p < .05).
