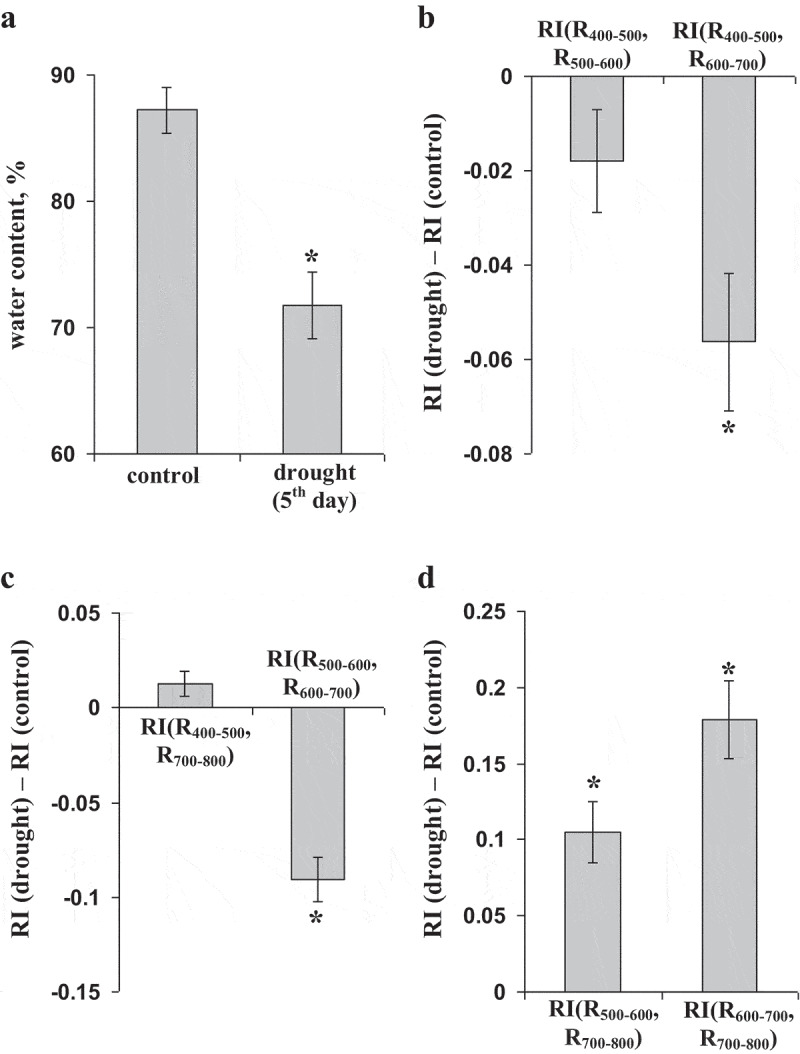
Figure 7.

An influence of the drought on the relative water content and reflectance indices (RIs), calculated on basis of broad spectral bands (n = 5). (a) The relative water contents in pea leaves under control (irrigation) and experimental (drought, 5th day without irrigation) conditions. (b) Differences between control and experimental RIs for RI(R400–500, R500–600) and RI(R400–500, R600–700). (c) Differences between control and experimental RIs for RI(R400–500, R700–800) and RI(R500–600, R600–700). (d) Differences between control and experimental RIs for RI(R500–600, R700–800) and RI(R600–700, R700–800). * indicates that difference from control value (for the relative water content) or difference from “0” (for differences between control and experimental RIs) were significant (p < .05).
