Figure 5.

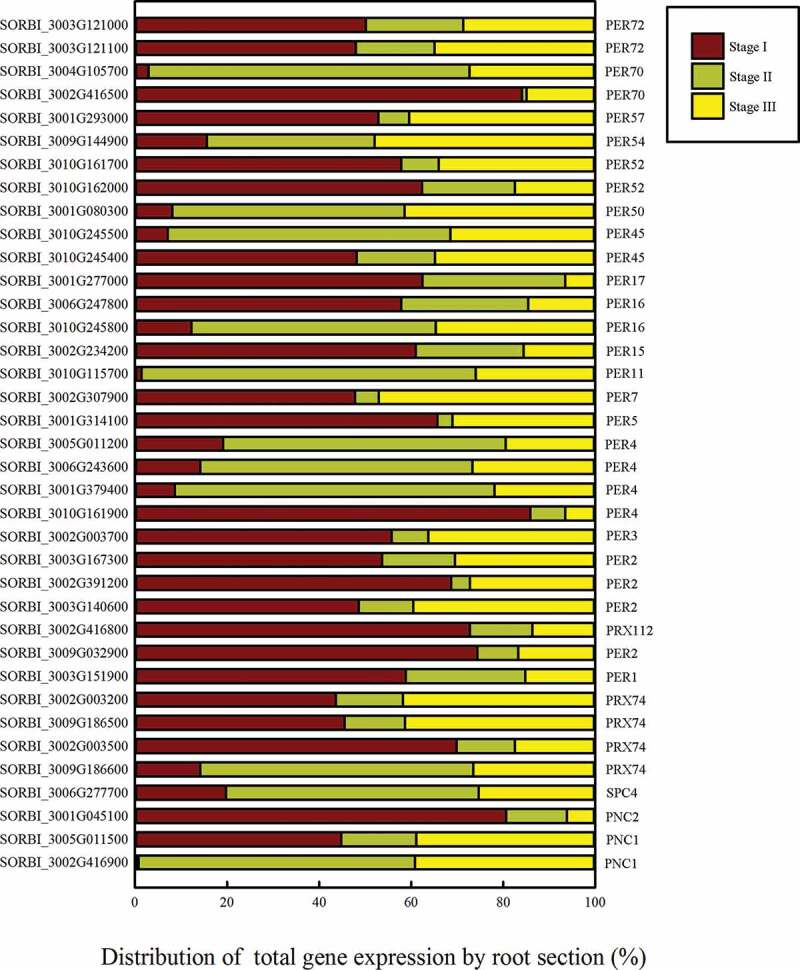
The distribution of the total expression of each gene in the peroxidase portion of the phenylpropanoid pathway. The gene expression level in each section is presented as a proportion of the total RPKM of the three sections.

The distribution of the total expression of each gene in the peroxidase portion of the phenylpropanoid pathway. The gene expression level in each section is presented as a proportion of the total RPKM of the three sections.