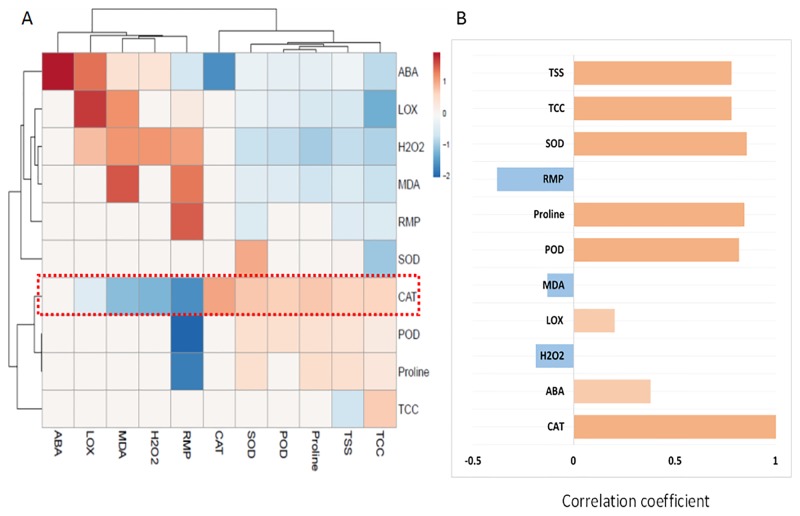
Fig 7. Heatmap analysis of Pearson’s correlation for the targeted stress indicators, osmolytes and antioxidant enzymes in maize seedlings (A and B) under control and drought stress conditions.
Pink and blue color indicates positive and negative correlations, respectively. The studied factors were correlated with catalase activity (CAT).

