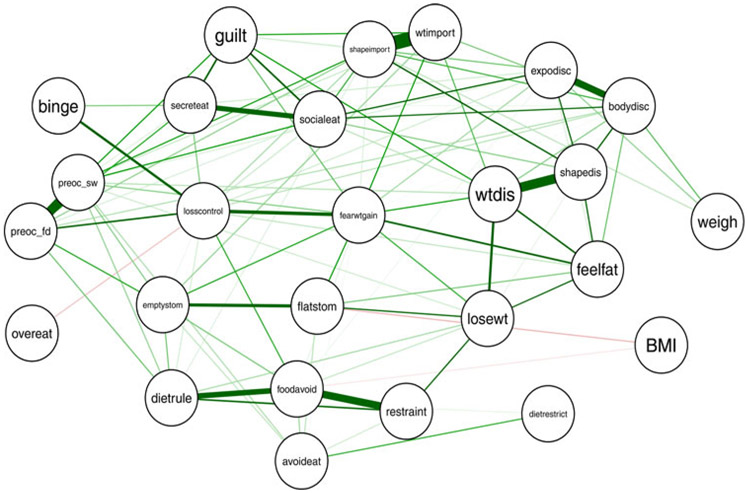
Fig. 1.
Regularized partial correlation network for binge-eating disorder (BED). Each node represents a symptom; each edge represents the regularized partial correlation between symptoms. Green and red edges represent positive and regularized correlations, respectively; thicker edges represent stronger correlations.

