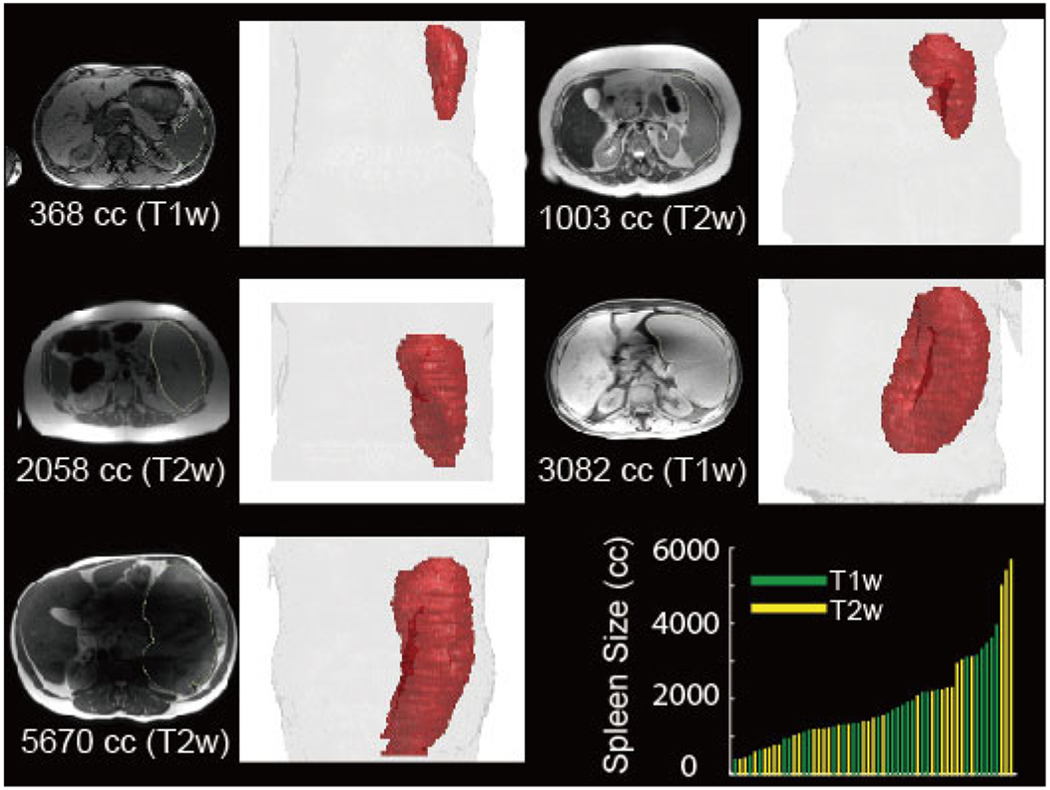
Fig. 1.

This figure illustrates the large anatomical and spatial variations of multi-modal splenomegaly MRI scans. The intensity images in axial view and 3D renderings of spleen are shown with the modality and spleen volume size in cubic centimeter (cc). The lower right panel summarizes the spleen volume size and modality for all scans in this study
