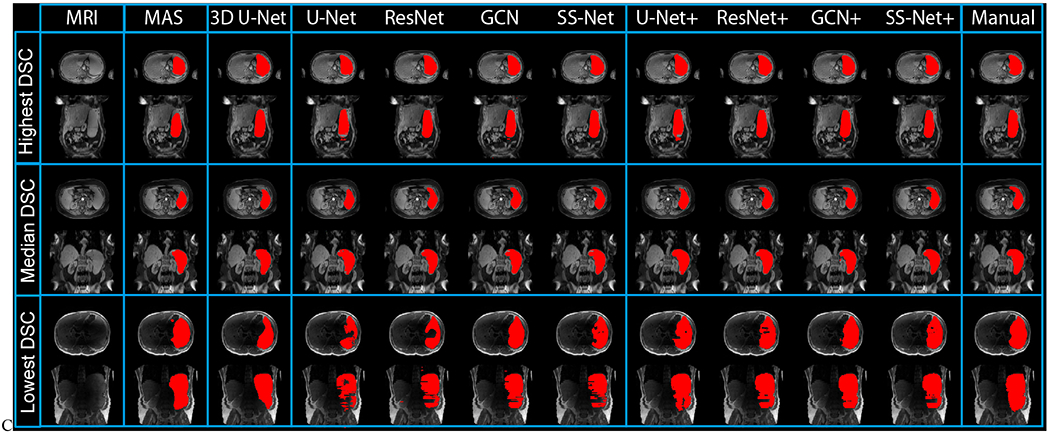
Fig. 9.

The qualitative results were presented in this figure. The results from three subjects (highest, median, and lowest Dice similarity coefficient (DSC) in SS-Net+) were showed in the upper, middle, and lower rows. Different segmentation methods were showed as different columns. The multi-atlas segmentation (MAS) results were presented as baseline. Then, 3D, 2D, and 2D+ models were presented to show the performance of DCNN methods. The right-most column reflected the manual segmentation results.
