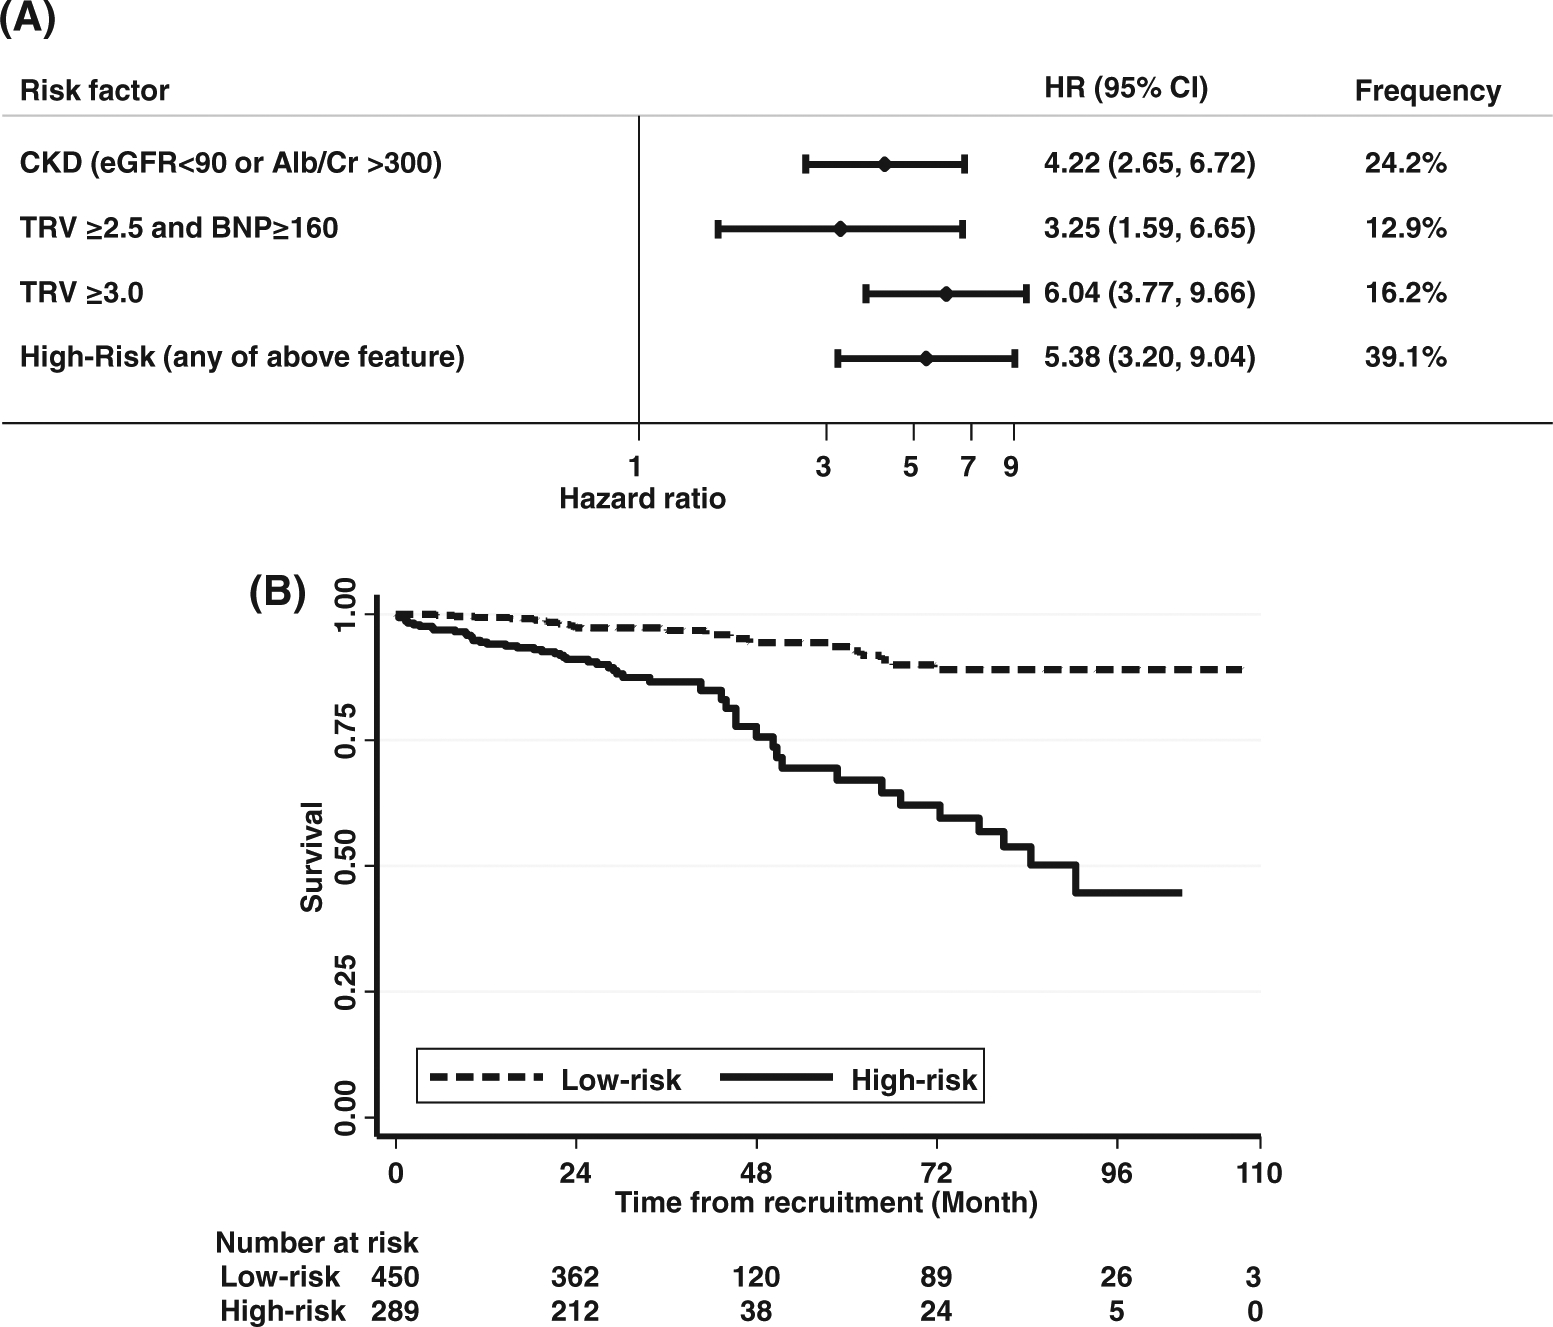
FIGURE 1.

a) Forest plot of association between component of high risk group and mortality b) Survival of patients by study group. The high-risk group are patients with TRV 2.5–2.9 m/sec and BNP≥160 pg/mL or TRV≥3.0 m/sec or chronic kidney disease (eGFR <90 mL/ min per 1.73 m2 or urine albumin to creatinine ratio >300). Survival was significantly lower in high-risk group (HR = 5.38, 95%CI = 3.20–9.04)
