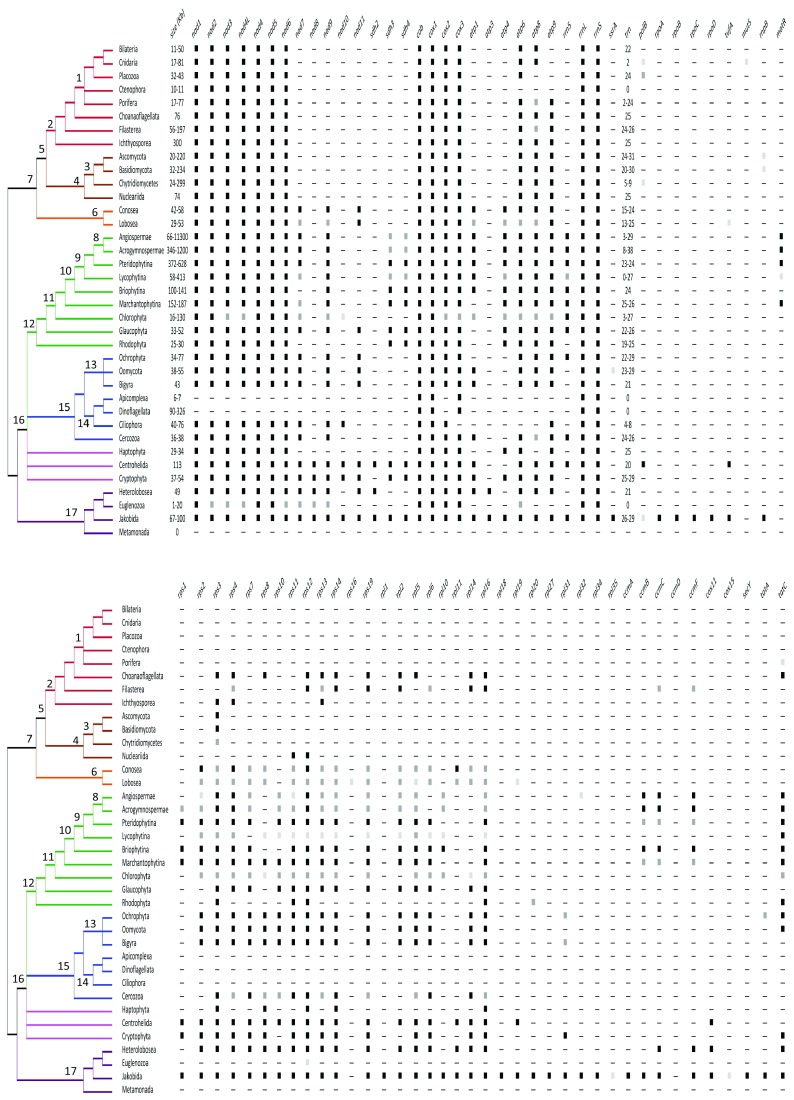
Figure 2. Gene content of mitogenomes.
The mitogenome size (in kilobases) and the presence of the different mitochondrial genes are shown. The black, dark, and light gray squares indicate that the gene was reported in all or almost all, most, or few taxa of the group, respectively. For tRNA genes, the number is provided. A consensus phylogeny of the eukaryotes 68 is depicted. Numbers in the nodes refer to the following: 1. Metazoa; 2. Holozoa; 3. Fungi; 4. Holomycota; 5. Ophistokonta; 6. Amoeobozoa; 7. Amorphea; 8. Spermatophytes; 9. Tracheophytes; 10. Embryophytes; 11. Viridiplantae; 12. Archaeplastida; 13. Stramenolipes; 14. Alveolata; 15. SAR; 16. Diaphoreticktes; 17. Excavata 68.

