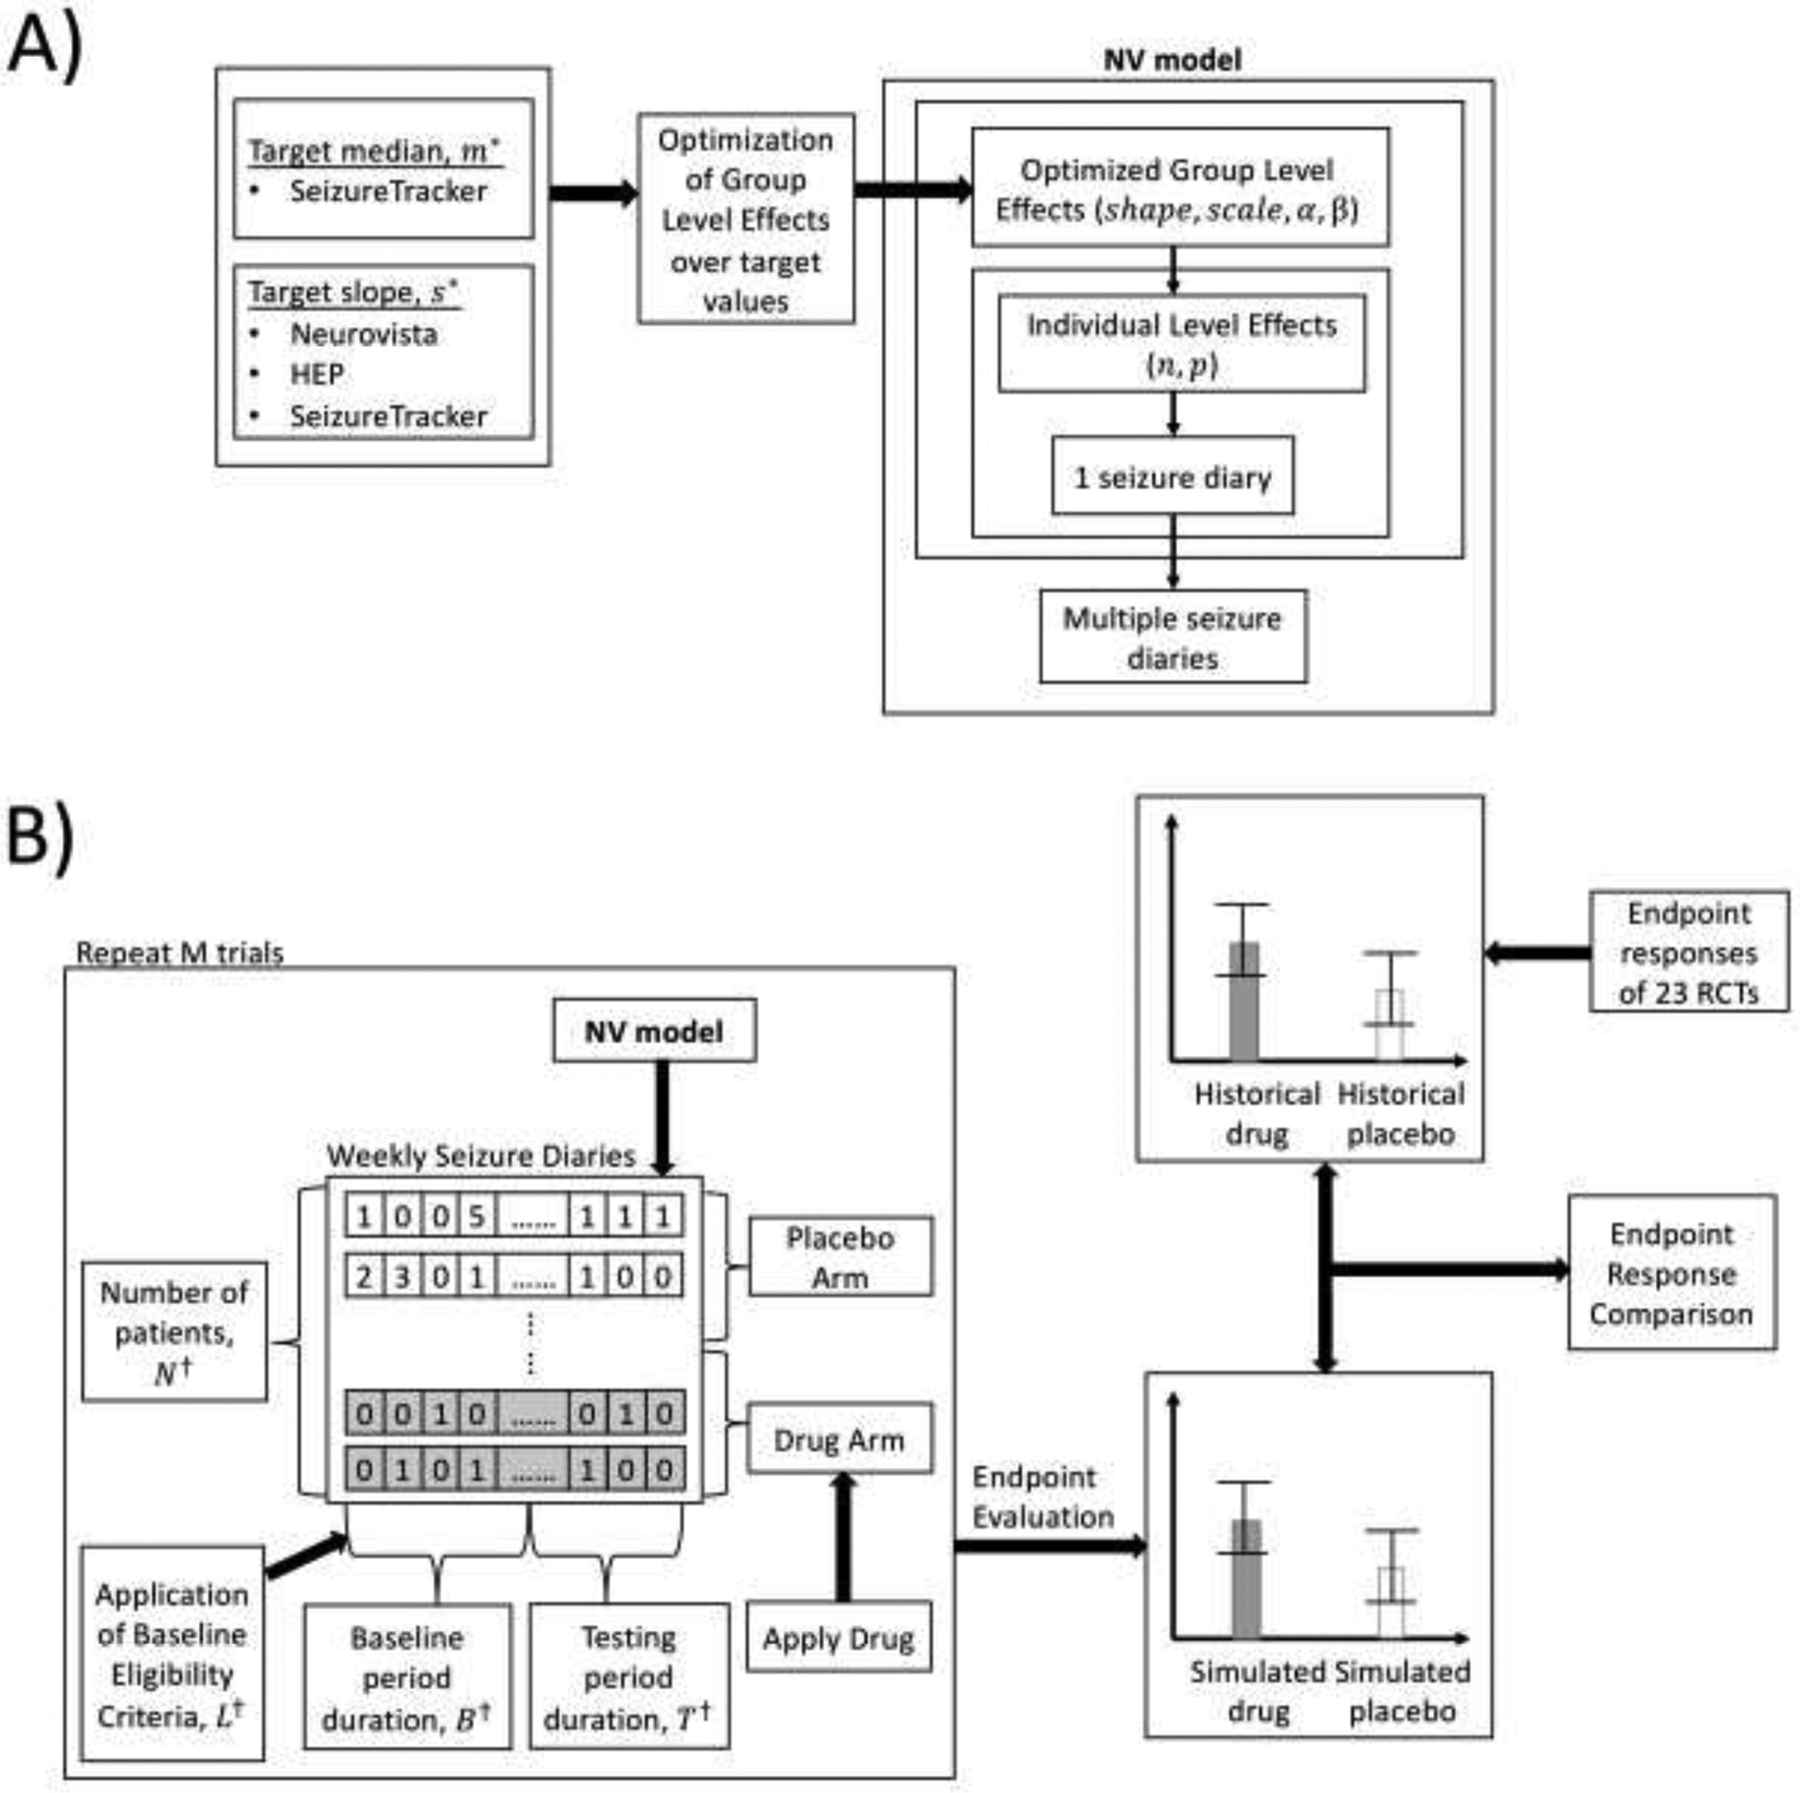
Figure 1:

A) Flow diagram of generation of synthetic seizure diaries corresponding to a simulated patient population via utilization of NV model, shown with optimization over group level parameters. None of the 23 RCTs in the endpoint response comparison were used to optimize over the group level parameters. B) Flow diagram of the endpoint response comparison, where two statistical summarizations of the endpoint responses from 5000 simulated RCTs and 23 historical RCTs were compared against each other. †All four of these RCT design parameters (N, B, T, L) were taken from the ezogabine RCT [13].
