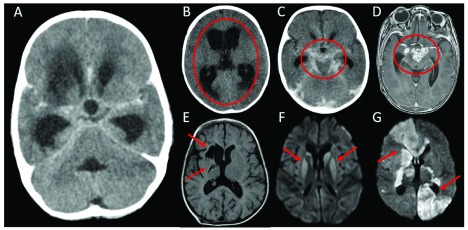
Figure 2. Neuroimaging findings.
A: Axial computed tomography (CT) with contrast, demonstrating the neuroimaging triad consistent with tuberculous meningitis (TBM) - hydrocephalus, basal meningeal enhancement and a right basal ganglia infarct; B: Axial CT without contrast showing diffuse ventricular dilatation and transependymal fluid shift consistent with severe hydrocephalus (circled); C: Axial CT with contrast showing enhancing exudate within the basal cisterns and surrounding the major vessels (circled); D: Axial T1 - weighted magnetic resonance image (MRI) with contrast demonstrating multiple ring-enhancing lesions in the suprasellar cistern consistent with tuberculomas (circled): E: Axial fluid-attenuated inversion recovery (FLAIR) MRI demonstrating chronic right basal ganglia infarcts (arrows); F: Axial diffusion-weighted imaging (DWI) demonstrating bilateral basal ganglia high signal intensities (arrows) consistent with restricted diffusion indicating subacute bilateral infarction (the corresponding B1000 - apparent diffusion coefficient (ADC) map demonstrated low signal in the affected areas); G: Axial DWI demonstrating multiple areas of high signal intensity (arrows) consistent with restricted diffusion indicating acute bilateral infarction (the corresponding B1000 - ADC map demonstrated low signal in the affected areas).

