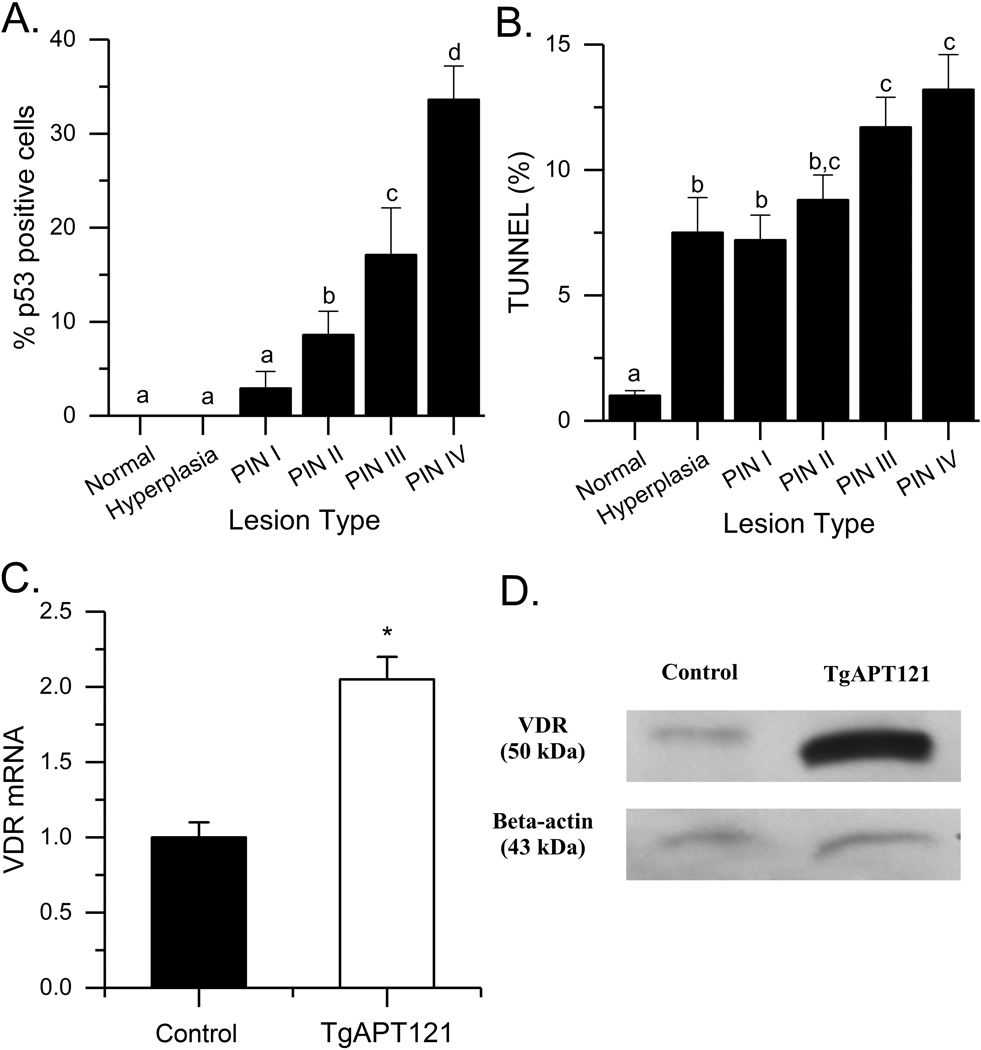
Fig. 1.
Impact of prostate phenotype progression on (A) P53 levels, (B) TUNEL staining. Bars are mean ± SEM (n = 5–28 images/lesion type, n=4 Control, 10 TgAPT121 mice). Data were analyzed by ANOVA followed by the Holm-Sidak pairwise multiple comparisons. Bars without a common letter superscript differ significantly (p < 0.05). (C) Vdr mRNA level in the dosolateral prostates of TgAPT121 and control mice. Bars are mean ± SEM. (* p < 0.01, n = 8/genotype, Student’s t test). (D) VDR protein level in pooled dorsolateral prostates (n = 8/pool).

