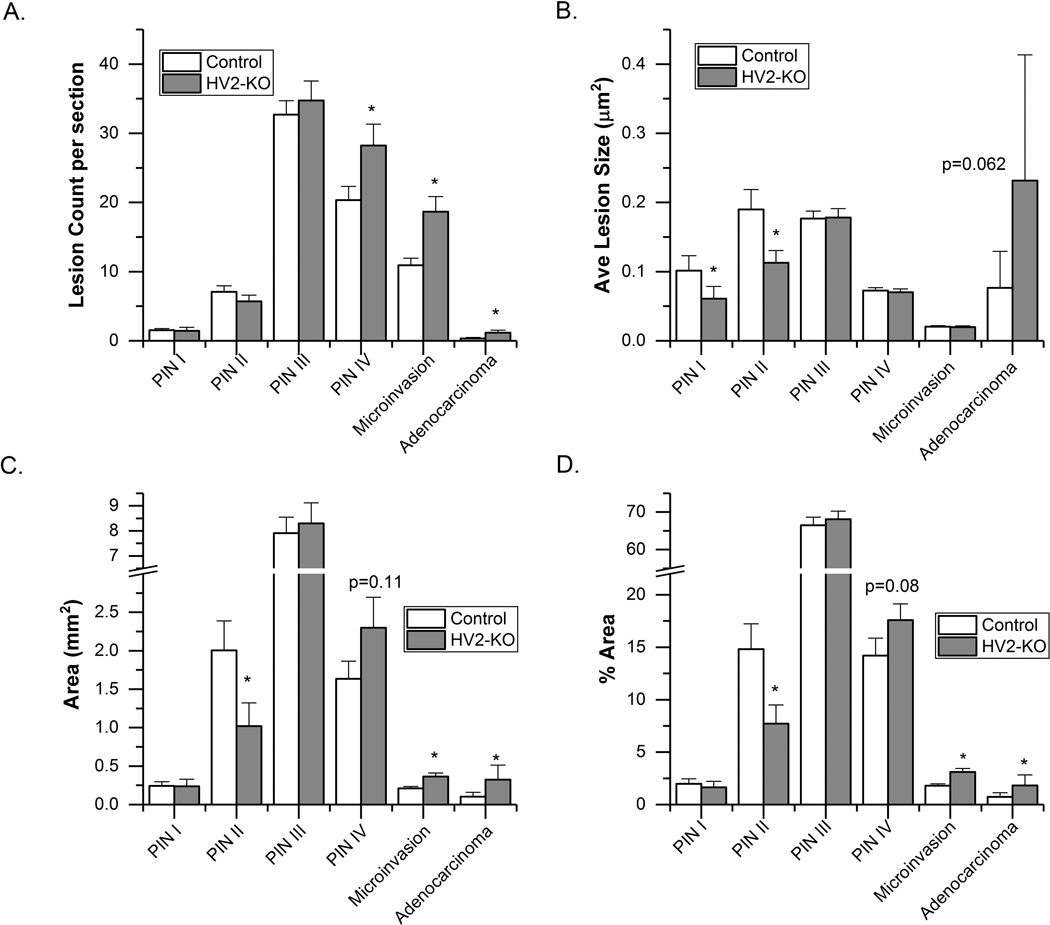
Fig. 3.
Histological grading of the anterior prostates from 26-wk old HV2-VDR KO (n = 23) and control mice (HV2+, VDR wild type, n = 27). (A) Count of independent lesion foci per section; (B) average lesion size; (C) area of each lesion; (D) % area of each lesion type. Bars are mean ± SEM. (*p < 0.05 vs Control). Other comparisons where the difference approached significance are reported with the measured p-value.

