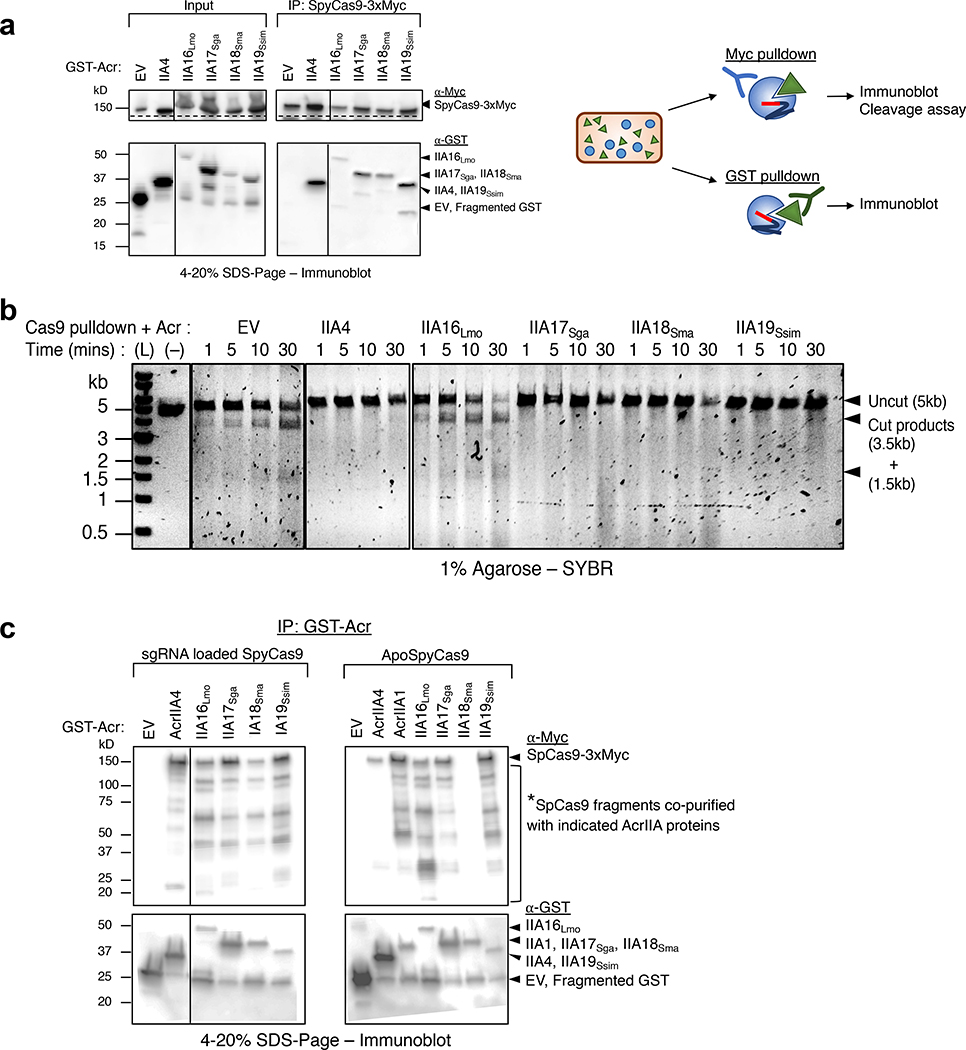
Fig. 4|. In vivo co-immunoprecipitation of AcrIIA16–19 and SpyCas9.
a, Immunoprecipitation of Myc-tagged SpyCas9-sgRNA (162kD) or GST-tagged Acr proteins (free-GST 27kD, IIA4 37kD, IIA16Lmo 50kD, IIA17Sga 39kD, IIA18Sma 48kD and IIA19Ssim 42kD). Left: Immunoblot probed with α-Myc (top) and α-GST (middle). Dashed lines indicate where image is cropped to show only the bands corresponding to full-length SpyCas9, see Extended Data Fig. 4c for uncropped version. Data shown are representative of two independent experiments. Right: Schematic of immunoprecipitation from P. aeruginosa cells co-expressing SpyCas9 and Acr proteins followed by analysis. b, Time courses of target DNA cleavage reactions using SpyCas9 co-immunoprecipitated with AcrIIA-proteins from Fig. 4b. Representative time-points are shown at the top of each lane. (L) 1kb dsDNA ladder, (–) DNA template alone. Data shown are representative of two independent experiments. c, Immunoprecipitation of GST-tagged Acr proteins (free-GST 27kD, IIA4 37kD, IIA1 44kD, IIA16Lmo 50kD, IIA17Sga 39kD, IIA18Sma 48kD and IIA19Ssim 42kD) from P. aeruginosa co-expressing guide-loaded SpyCas9 or ApoSpyCas9 without sgRNA (162kD). Immunoblot for Myc-Cas9 (top) or GST-Acr (bottom). Data shown are representative of two independent experiments.

