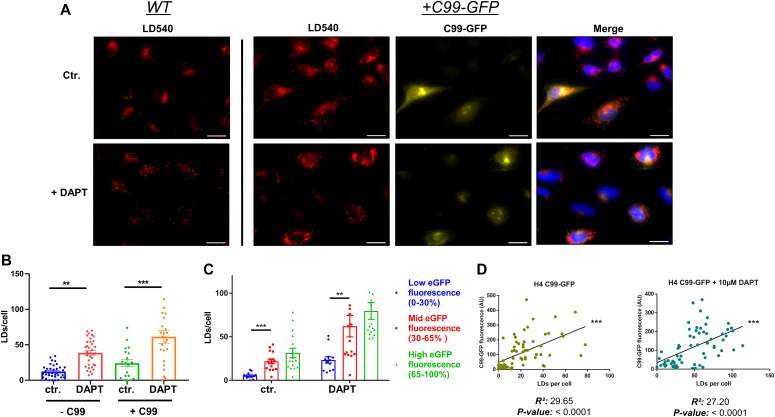
Figure 7. Cellular levels of amyloid precursor protein–C-terminal fragments correlate with cellular lipid droplet (LD) content.
(A) Representative fluorescence microscopy images of WT and C99-GFP overexpressing H4 cells with and without DAPT treatment for pharmacological inhibition of γ-secretase activity. Cells were stained for LDs with the LD540 dye. Higher levels of LDs can be observed in both WT and +C99-GFP cells after DAPT treatment, and C99-GFP overexpressing cells show higher LD levels than WT cells. In addition, cells containing elevated levels of C99-GFP display a noticeably higher number of LDs, both in the presence and absence of DAPT. Scale bar = 20 μm. (B) Quantification of LDs per cell (n = 16). Significance was analyzed by one-way ANOVA and Holms–Sidak multiple comparison test. (C) Quantification of LD levels as a function of cellular C99-GFP fluorescence. Cellular C99-GFP fluorescence levels were categorized in three different groups: Low (0–30% of max), mid (30–70% of max), and high (70–100% of max). Higher LD levels were observed in the groups with elevated C99-GFP fluorescence (n = 23). Significance was analyzed by one-way ANOVA and Holms–Sidak multiple comparison test. (D) Pearson linear correlation analysis of LDs and average cellular C99-GFP fluorescence. **P ≤ 0.01, ***P ≤ 0.001.

