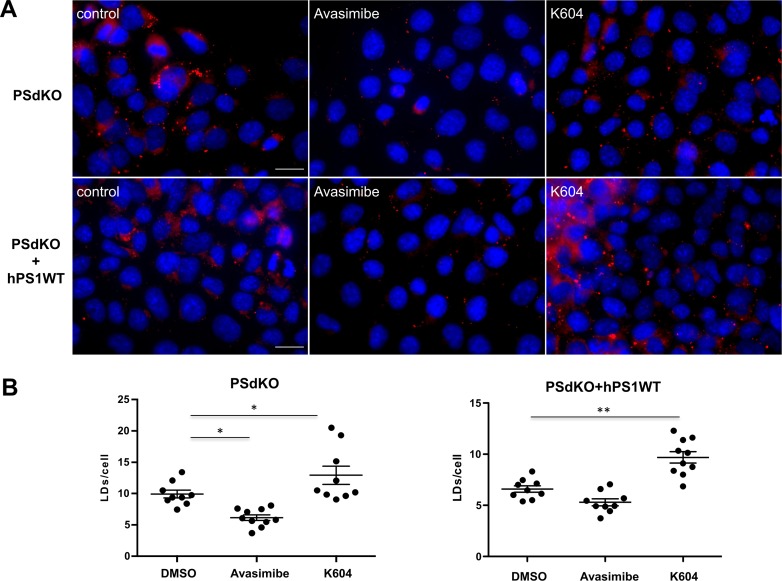
Figure S2. Effects of ACAT inhibitors on lipid droplet (LD) content in MEFs with and without expression of PS1.
(A, B) PSdKO MEF or PSdKO MEF reexpressing hPS1WT (PSdKO + hPS1WT) were cultured in the absence or presence of Avasimibe (10 μM) or K604 (15 μM) and co-stained with LD540 and DAPI to visualize LDs and nuclei, respectively. (A) Representative fluorescence microscopy images. Scale bar, 20 μm. (B) Quantification of the number of LDs per cell. Data shown are average values ± SEM, n = 3. Significance was analyzed by one-way ANOVA and Holms–Sidak multiple comparison test. *P ≤ 0.05, **P ≤ 0.01.

