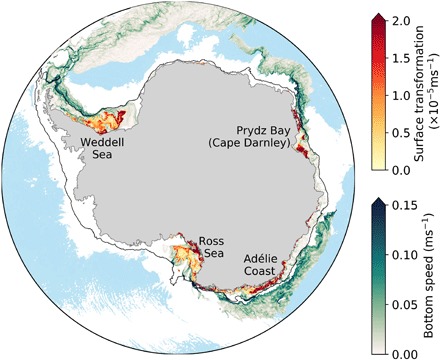
Fig. 1. Model simulation of the source locations and descending pathways of dense water.

Surface water mass transformation across σ1 = 32.57 kg/m3 is shown in red colors. Bottom speed is shown in green colors in the descending pathways of dense water (where bottom density σ4 >46.105 kg/m3). Blue background shading shows bathymetry deeper than 4000 m. The black line represents the 1000-m isobath contour.
