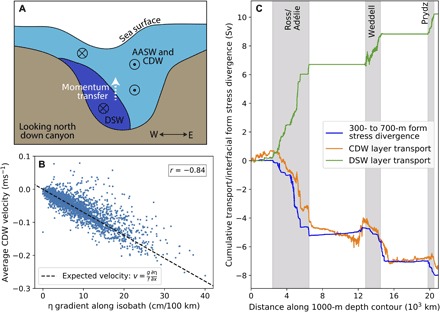
Fig. 5. Demonstration of canyon exchange mechanism.

(A) The schematic view shows a canyon cross section looking toward the open ocean. Dense water hugs the left of the canyon as it descends and lowers the sea surface height above (exaggerated scale). The sea surface variation results in a barotropic pressure gradient that drives AASW and CDW onshore to the east. Directions of flow are indicated by arrow heads and tails. Interfacial form stress transfers momentum upward from the DSW layer to the CDW and AASW layers above. (B) Relationship between the 1000-m cross-isobath velocity in the CDW layer and the sea surface height gradient along the 1000-m isobath in the Glomar Challenger Trough. Each point shows a 3-hour average over a 1-year time period. The dashed line shows the expected geostrophic velocity resulting from the barotropic pressure gradient. Downslope velocities are defined as positive. The correlation coefficient (r) between ∂η/∂x and the simulated model velocity is given. (C) The along-isobath cumulative sum of the interfacial form stress divergence summed over middepths (300 to 700 m, blue), compared with cross-isobath water mass transports summed over isopycnal layers.
