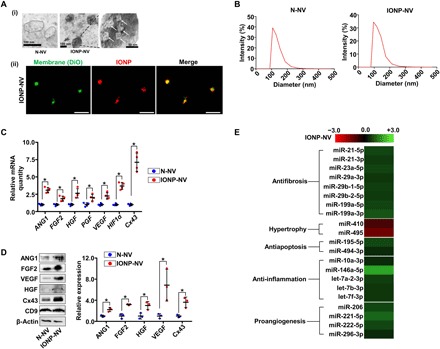
Fig. 2. Preparation and characterization of MSC-derived NVs.

(A) (i) TEM images of N-NVs and IONP-NVs and (ii) confocal images of IONP-NVs. White arrows indicate IONPs within IONP-NVs. In the fluorescent confocal images, NV lipid layers and IONPs were labeled with DiO (green) and RITC (red), respectively. Scale bars, 1 μm (ii). (B) Representative size distribution of N-NVs and IONP-NVs derived from MSCs and IONP-MSCs, respectively, as evaluated by DLS. (C) Relative mRNA levels in N-NVs and IONP-NVs, as evaluated by qRT-PCR (n = 4 per group). (D) Representative images of Western blots of therapeutic molecules and the marker of EV, CD9 (n = 3 per group). (E) Fold changes in levels of cardiac repair–related microRNA (miRNA) in IONP-NVs compared to N-NVs. All columns represent log2-fold changes. *P < 0.05 by two-tailed t test. All values are means ± SD.
