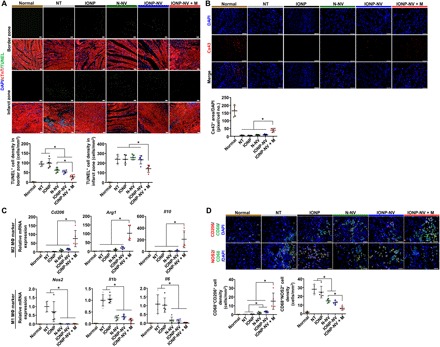
Fig. 5. Attenuation of cell apoptosis and inflammation by IONP-NV injection in vivo.

(A) Representative images of TUNEL-positive (green) apoptotic cells and immunostaining for cardiac troponin T (cTnT) (CM marker) and the quantitative data 1 day after injection (n = 5 animals per group). Scale bars, 100 μm. (B) Representative images of immunohistochemical staining for Cx43 in the peri-infarct zone and the quantitative data 1 day after injection (n = 5 animals per group). Scale bars, 100 μm. (C) Relative mRNA expression levels of M2 macrophage–specific markers (Cd206, Arg1, and Il10) and M1 macrophage–specific markers (Nos2, Il1b, and Il6) in the infarcted myocardium, as evaluated by qRT-PCR (n = 5 animals per group). (D) Immunohistochemical staining for CD68 (macrophage marker), CD206 (M2 macrophage marker), and nitric oxide synthase 2 (NOS2) (M1 macrophage marker); and the quantitative data in the peri-infarct zone 1 day after injection (n = 5 animals per group). Scale bars, 50 μm. *P < 0.05, using one-way ANOVA, followed by post hoc Bonferroni test. All values are means ± SD.
