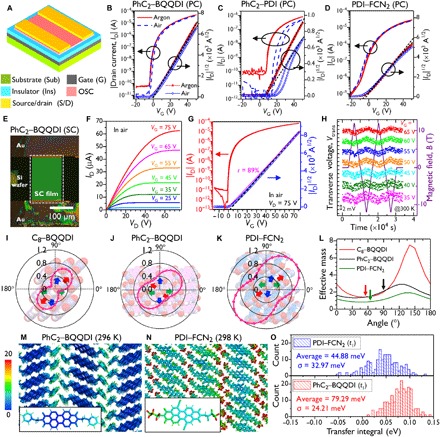
Fig. 5. TFT evaluations and theoretical analyses.

(A) General TFT structure used in this work. Details of the components are described in the respective captions. (B to D) Transfer characteristics of PC-TFTs [Sub = G = n++-Si; Ins = SiO2 (200 nm) + DTS-SAM, Ci = 17.3 nF cm−2; S/D = Au (40 nm)] based on PhC2–BQQDI, PhC2–PDI, and PDI–FCN2, respectively. Red and blue symbols indicate data acquired under Ar and ambient air, respectively. Black dashed lines fit the square root of drain current (|ID|1/2), allowing μe to be estimated. (E) A polarized microscopy image of a PhC2–BQQDI SC-TFT (L = 190 μm, W = 136 μm) [Sub = G = n++-Si; Ins = SiO2 (200 nm) + AL-X601 (60 nm), Ci = 12.5 nF cm−2; S/D = Au (40 nm)]. (F) The corresponding output characteristics and (G) transfer characteristic (VD = 75 V). Black dashed and magenta solid lines represent the fit to |ID|1/2 and the slope of an electrically equivalent ideal TFT (41). (H) Gated Hall effect data obtained from a PhC2–BQQDI SC-TFT at 300 K. At VG ≥ 35 V, the transverse voltage (Vtrans, colored dots) was modulated using an applied magnetic field (B, purple solid line). (I) Packing structures in the ac- and ab-planes with estimation of the inverses of effective masses for C8–BQQDI. (J) Packing structures in the bc- and ab-planes with estimates for the inverses of effective masses for PhC2–BQQDI. (K) Packing structures in the bc- and ab-planes with estimates of the inverses of effective mass for PDI–FCN2. (L) Angle-resolved effective masses for C8–BQQDI, PhC2–BQQDI, and PDI–FCN2. Arrows indicate the channel directions of the SC-TFTs evaluated in this work. (M and N) Color-coded B-factor distributions (unit: Å2 s−1) for PhC2–BQQDI and PDI–FCN2 obtained from the trajectories during the last 20 ns of a 100-ns MD run. (O) Statistical distributions of intermolecular transfer integrals (t1) at 100 ns for PhC2–BQQDI and PDI–FCN2. The magnitude of the dynamic fluctuations of t1 can be evaluated based on the SD (σ). The effective mass is shown in unit of the rest mass of an electron.
