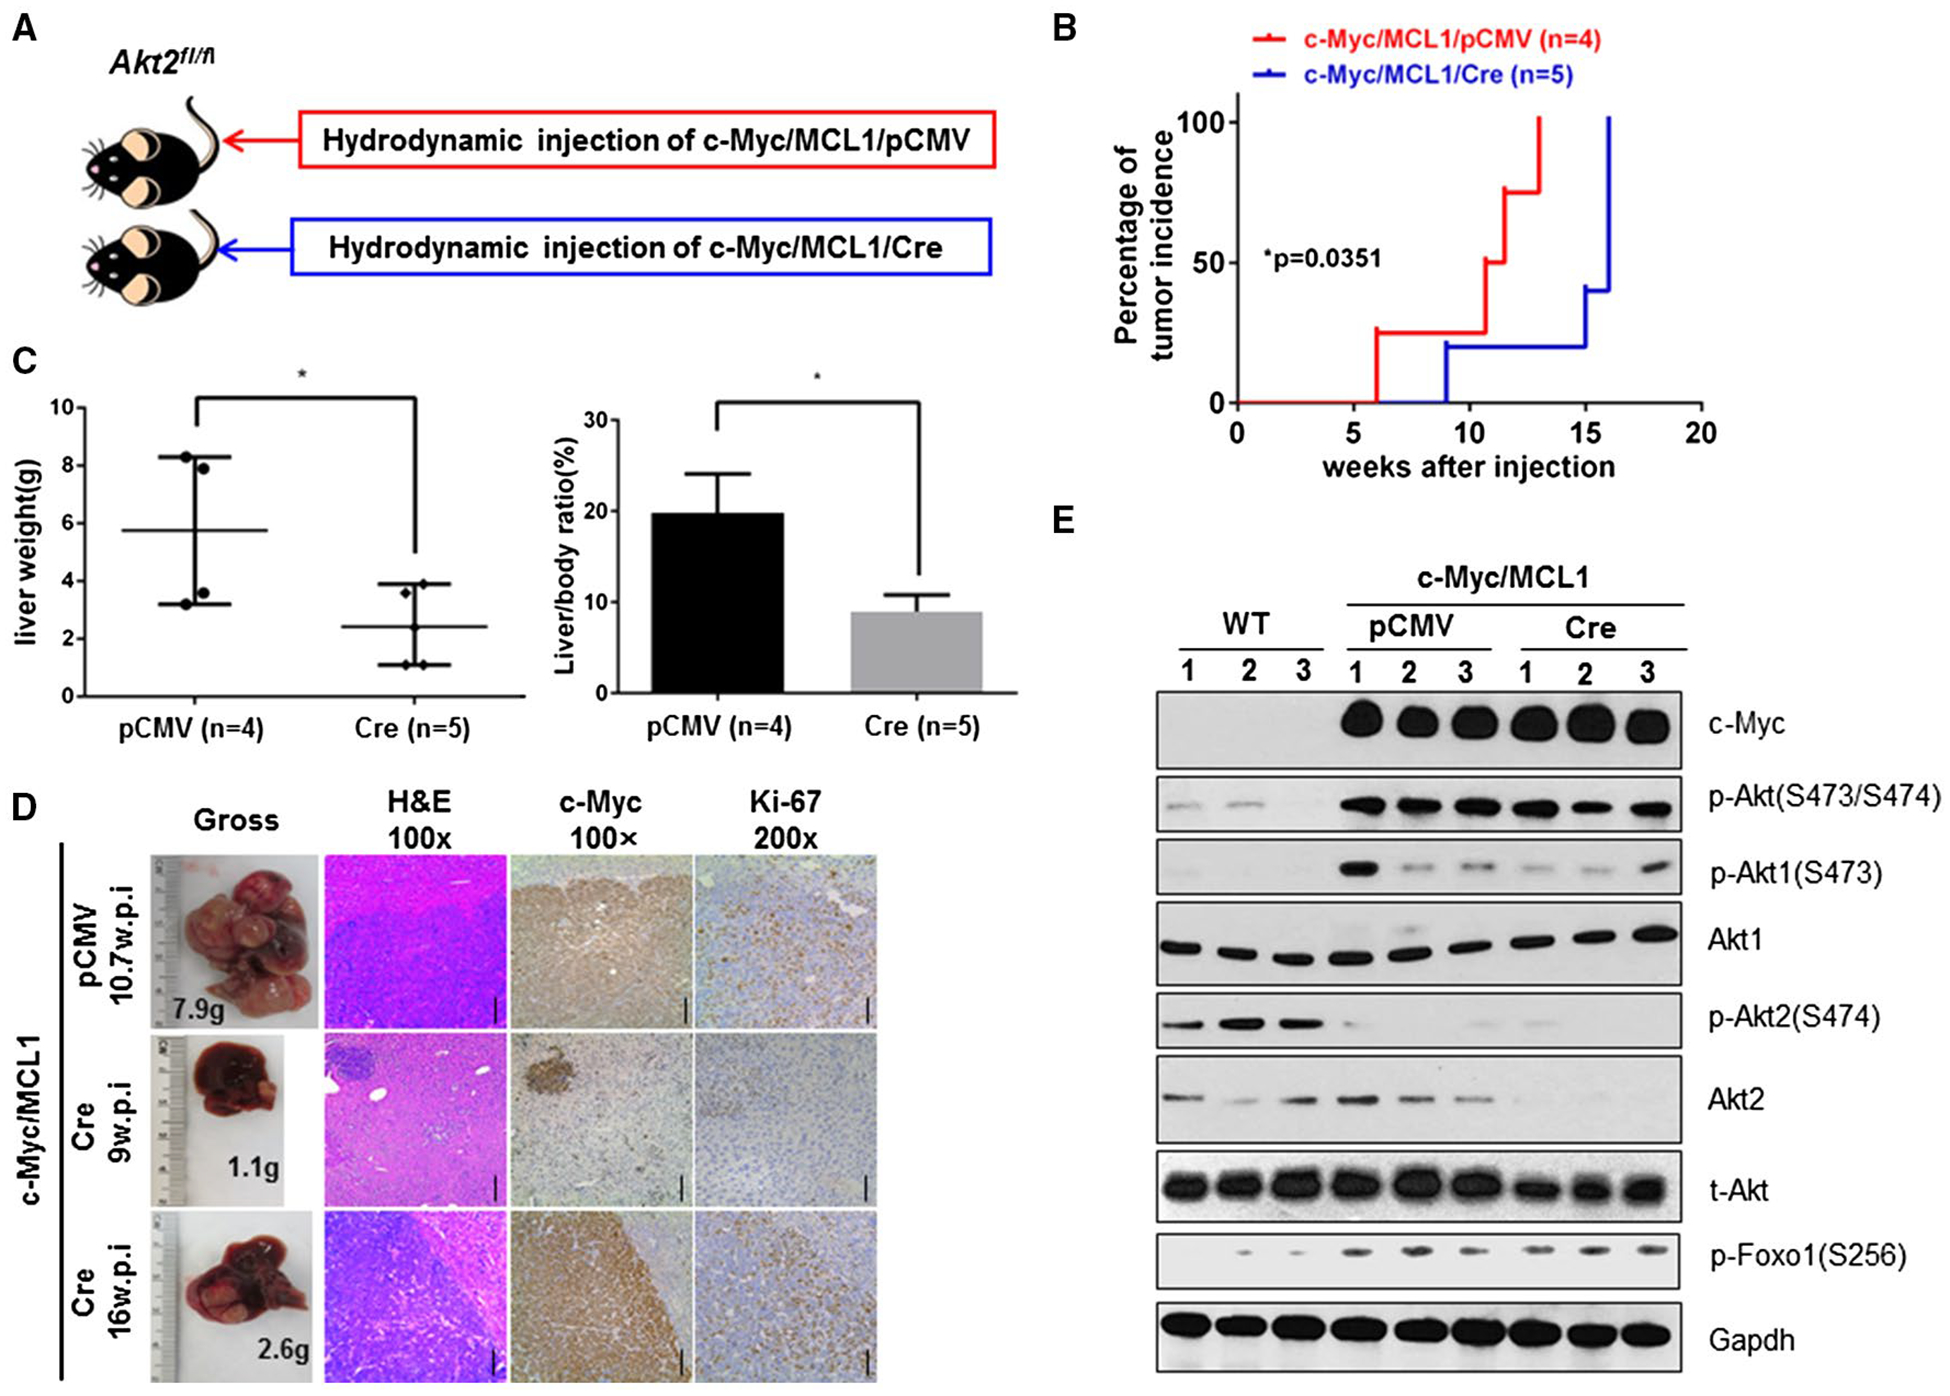
FIG. 4.

Delayed c-Myc-driven HCC formation in Akt2 conditional KO mice. (A) Study design. (B) Tumor incidence curve. (C) Liver weight and liver/body ratio of Akt2fl/fl mice injected with c-Myc/MCL1/pCMV and c-Myc/MCL1/Cre constructs, respectively. *P < 0.05. (D) Gross images of livers, hematoxylin and eosin, c-Myc, and Ki-67 staining in Akt2fl/fl mice injected with c-Myc/MCL1/pCMV or c-Myc/MCL1/Cre constructs at specific weeks postinjection. Magnifications ×100 (hematoxylin and eosin, c-Myc), scale bar, 200 μm; ×200 (Ki-67), scale bar, 100 μm. (E) Representative western blotting from Akt2fl/fl mouse liver tissue or Akt2fl/fl mouse liver tissue injected with c-Myc/MCL1/pCMV or c-Myc/MCL1/Cre. Abbreviations: Gapdh, glyceraldehyde 3-phosphate dehydrogenase; H&E, hematoxylin and eosin; t-, total; w.p.i., weeks post injection.
