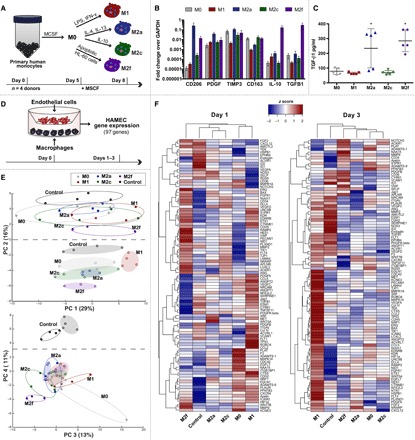
Fig. 1. Overview of phenotype-induced changes in EC gene expression via Transwell culture with macrophages.

(A) Primary human peripheral blood monocytes were isolated from four human donors, differentiated into macrophages, and polarized into M0, M1, M2a, M2c, or M2f phenotypes for 72 hours. (B) Gene expression of commonly associated M2 markers. (C) Levels of TGFB1 in cell culture media. Data in (B) and (C) represent means ± SEM with n = 3 to 5 technical replicates from one human donor. Differences were determined using one-way ANOVA with Tukey’s multiple comparisons test; *P < 0.05 relative to M0, M1, and M2c phenotypes. (D) Primary HAMECs were Transwell cocultured with M0, M1, M2a, M2c, or M2f macrophages for 1 to 3 days. Changes in HAMEC gene expression were analyzed using a custom CodeSet from NanoString Technologies, inclusive of 97 genes related to angiogenesis. (E) PCA of HAMEC gene count data. To facilitate visualization, color-coded ellipses were drawn to include all samples for each phenotype. Open ellipses represent day 3 data; shaded ellipses represent day 1 data. (F) Gene counts for HAMEC treated with M0, M1, M2a, M2c, or M2f macrophages were z scored across rows and hierarchically clustered on the basis of Euclidean distance.
