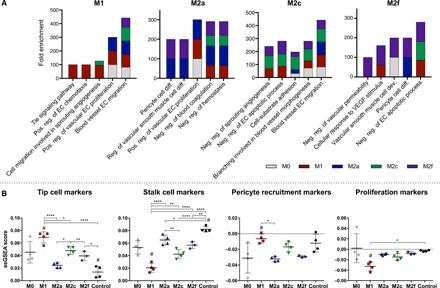
Fig. 2. Macrophage phenotypes differentially influence biological processes in ECs after 1 day of Transwell coculture.

GO enrichment analysis was performed on lists of genes differentially regulated in ECs in response to macrophage phenotype. (A) Top five most highly enriched, nonredundant GO terms for each phenotype. (B) ssGSEA for gene sets related to specific processes of angiogenesis; analysis was not restricted to only differentially expressed genes. One-way ANOVA with Tukey’s post hoc analysis; *P < 0.05; **P < 0.01; ****P < 0.0001, # indicates P < 0.05 relative to the M0 control.
