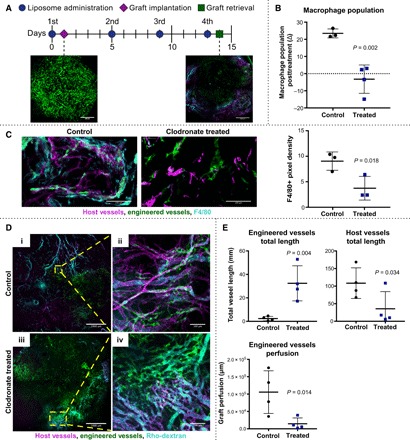
Fig. 5. Consequences of in vivo macrophage depletion on graft revascularization and integration with host vessels.

(A) Timeline of clodronate- or PBS-loaded liposome administration, graft implantation, and retrieval. Representative images show engineered vessels (green) in graft before implantation and following retrieval. Host vessels shown in magenta and Rho-dextran perfusion in cyan. Scale bars, 1000 μm. (B) Flow cytometric analysis of whole-blood staining against the pan macrophage marker, murine F4/80, following the second administration of liposomes; n = 3 to 4. (C) Immunofluorescence staining and quantification of pan macrophage marker F4/80 (cyan) in grafts from macrophage-depleted (clodronate-liposome–treated) versus control (PBS-liposome–treated) mice 14 days after implantation. Scale bars, 100 μm. (D) Representative maximum-intensity projections of retrieved grafts 14 days after implantation in (i) control mice and (iii) macrophage-depleted mice. Scale bars, 1000 μm. High-magnification images of (ii) control and (iv) macrophage-depleted grafts. Scale bars, 100 μm. Host vessels shown in magenta, engineered vessels shown in green, and grafts perfused with Rho-dextran shown in cyan. (E) Quantification of total vessel length via AngioTool for engineered vessels and host vessels; engineered vessel perfusion of maximum-intensity projections analyzed using a custom MATLAB code. All data represent means ± SD and were analyzed using an unpaired t test with n = 3 to 4.
