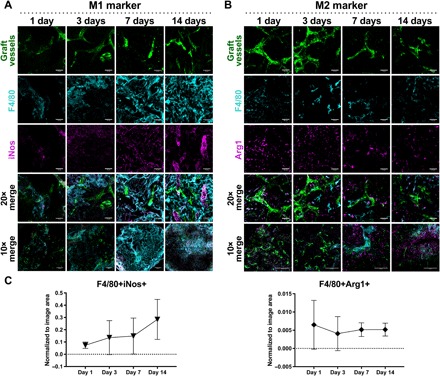
Fig. 6. Macrophage phenotype subsets during graft integration.

Representative maximum-intensity projections of engineered vascular grafts bearing GFP-expressing vasculature (green) extracted on days 1, 3, 7, and 14 after implantation and sectioned. Graft sections were stained for pan macrophage marker F4/80 (cyan) and costained for either iNos [magenta, (A)] or Arg1 [magenta, (B)] to determine presence of macrophages expressing M1 (A) and M2 (B) markers. Scale bars, 50 μm. (C) Quantification of F4/80+iNos+ staining and F4/80+Arg1+ staining. Data represent means ± SD and were assessed via one-way ANOVA with Tukey’s post hoc analysis; n = 3 to 4.
