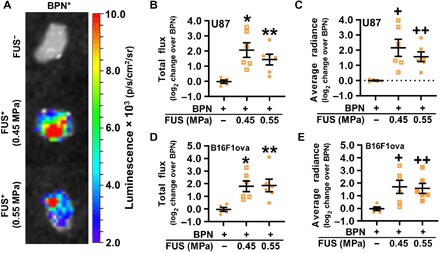
Fig. 2. MRI–guided transfection of brain tumors with intravenously administered BPNs and FUS.

(A) Bioluminescence images of U87 tumors 3 days after treatment. Tumors are ~2 to 3 mm in diameter. (B and C) Luciferase expression in U87 gliomas, presented as total flux (B) and average radiance (C). Means ± SEM; *P = 0.004, **P = 0.040, +P = 0.006, and ++P = 0.040 versus BPN. (D and E) Luciferase expression in intracranial B16F1ova melanomas, presented as total flux (D) and average radiance (E). Means ± SEM; *P = 0.020, **P = 0.016, +P = 0.027, and ++P = 0.040 versus BPN. Significance was assessed in all graphs by one-way ANOVA followed by Tukey’s t tests.
