Abstract
Heightened aggression is characteristic of multiple neuropsychiatric disorders and can have various negative effects on patients, their families, and the public. Recent studies in humans and animals have implicated brain reward circuits in aggression and suggest that, in subsets of aggressive individuals, domination of subordinate social targets is reinforcing. Here, we show that in male mice, orexin neurons in the lateral hypothalamus activate a small population of glutamic acid decarboxylase 2 (GAD2)-expressing neurons in the lateral habenula (LHb) via orexin receptor 2 (OxR2). and activation of these GAD2 neurons promotes male–male aggression and conditioned place preference (CPP) for aggression-paired contexts. Moreover, LHb GAD2 neurons are inhibitory within the LHb and dampen the activity of the LHb as a whole. These results suggest that the orexin system is important for the regulation of inter-male aggressive behavior and provide the first functional evidence of a local inhibitory circuit within the LHb.
Various psychiatric syndromes are associated with increased risk for pathological aggressive behaviors, including autism spectrum disorders1, ADHD2, personality disorders3, and mood disorders4. It has been hypothesized that brain reward systems controlling the valence of social interactions may be dysregulated in these disorders, leading to heightened aggression that is reinforcing5–7. Recent studies in animals find that a subset of highly aggressive male mice will lever press for access to subordinate intruders8 and form conditioned-place preferences (CPP) for contexts that are associated with access to subordinate intruders9. This suggests that male mice find the domination of subordinate social targets to be rewarding and display high motivation for repeated opportunities to fight.
Given the strong motivational component to aggressive behavior, there has been increasing interest in the role that reward circuitry plays in controlling aggression. One region in particular, the lateral habenula (LHb), has been newly identified as a potential modulator of the valence of aggressive social interactions10. The LHb is a critical node within the reward circuitry of humans and non-human animals that, when activated, promotes negative emotional states predominantly through indirect inhibition of midbrain dopamine neurons11, 12. LHb function is disrupted in various neuropsychiatric disorders associated with aggression, including mood disorders13, 14. In zebrafish and mice, functional manipulation of LHb neurons alters aggression, its rewarding properties, and the likelihood of “winning” a fight. Specifically, optogenetic inhibition of mouse LHb neurons during the test phase of the aggression-CPP task increases the time spent in the aggression-paired context, whereas optogenetic activation of these neurons reduces it9. In addition, direct optogenetic activation of a zebrafish homologue of the mammalian LHb results in increased probability of losing a fight15. While these results highlight the importance of the LHb in aggression, the specific LHb inputs as well as the local LHb circuitry regulating aggression remain largely unknown.
Previous studies have described the LHb as consisting almost exclusively of glutamate projection neurons expressing vesicular glutamate transporter 2 (vGlut2)16. However, there is recent histological and single-cell sequencing evidence that the LHb contains a small population of cells that express glutamate decarboxylase 2 (GAD2)17, 18, which is a general marker of GABAergic inhibitory neurons. Despite these recent studies, very little is known about GAD2 neurons in the LHb, including which inputs target them or whether they are capable of providing local inhibition, long-range inhibition, or both. Recent studies have reported that they are enriched in receptors for a number of hypothalamic-derived neuropeptides and hormones, including orexin receptor 2 (OxR2)17, 18. As orexin neuron cell bodies are located solely in the lateral hypothalamus (LH)19, this suggests that LHb GAD2 neurons are modulated by projections from lateral hypothalamic orexin neurons. Though not previously implicated in aggression, orexin has been strongly implicated in arousal20, social behavior21, and a wide array of motivated behaviors22–26.
Here, we set out to characterize the cell-type-specific dynamics of LHb neurons during aggression and determine whether orexin release onto GAD2 LHb neurons influences aggressive behavior. First, we show that LHb vGlut2 neurons reduce their activity during aggression, whereas GAD2 LHb neurons increase their activity. We show that GAD2 LHb neurons exert local inhibitory control over the LH as a whole, and that direct optogenetic manipulation of GAD2 LHb neurons alters aggression and aggression-CPP. Further, we demonstrate that direct optogenetic modulation of orexin inputs from the LH to the LHb promotes aggression and aggression-CPP through an OxR2-dependent mechanism. Our findings indicate that cell-type-specific engagement of orexin signaling in the LHb is important for modulating aggression and extend orexin’s known role in motivation to the social realm.
Results
Aggression is associated with reduced total LHb activity
To first investigate patterns of total LHb activity associated with repeated aggressive social encounters, we injected non-conditional AAV-GCaMP6 into the LHb, implanted a fiber above the cells, and measured fluorescent calcium transients in highly aggressive (AGG) and non-aggressive (NON) CD-1 wild-type mice during the resident intruder (RI) and aggression- CPP tests using fiber photometry (Fig. 1a–b). In the RI test, male CD-1 outbred mice are exposed to submissive male C57BL/6J intruders for 5 minutes in their home cage and allowed to freely interact. CD-1 mice display individual variation in aggressive behaviors in this task, with some animals consistently fighting with low attack latencies (termed aggressors, AGGs) and some animals never engaging in any aggressive behaviors (termed non-aggressors, NONs). Importantly, because CD-1 resident mice are vastly larger and more dominant than C57BL6/J intruder mice, AGGs engaging in fighting during RI consistently subordinate intruder mice and are never themselves attacked by the intruder. In aggression CPP, animals are conditioned in two 10 minute sessions per day for 3 days to associate distinct contexts with the presence or absence of subordinate intruders. On test day, experimental mice are given free access to both contexts (in the absence of intruders) and the time spent in each context is measured to determine the valence of the social encounter. NONs form an aversion for the intruder-paired context, whereas AGGs form a preference for it, suggesting that AGGs find these social encounters rewarding and will seek out opportunities for aggression9.
Figure 1: Aggressive behaviors are associated with decreased LHb activity.
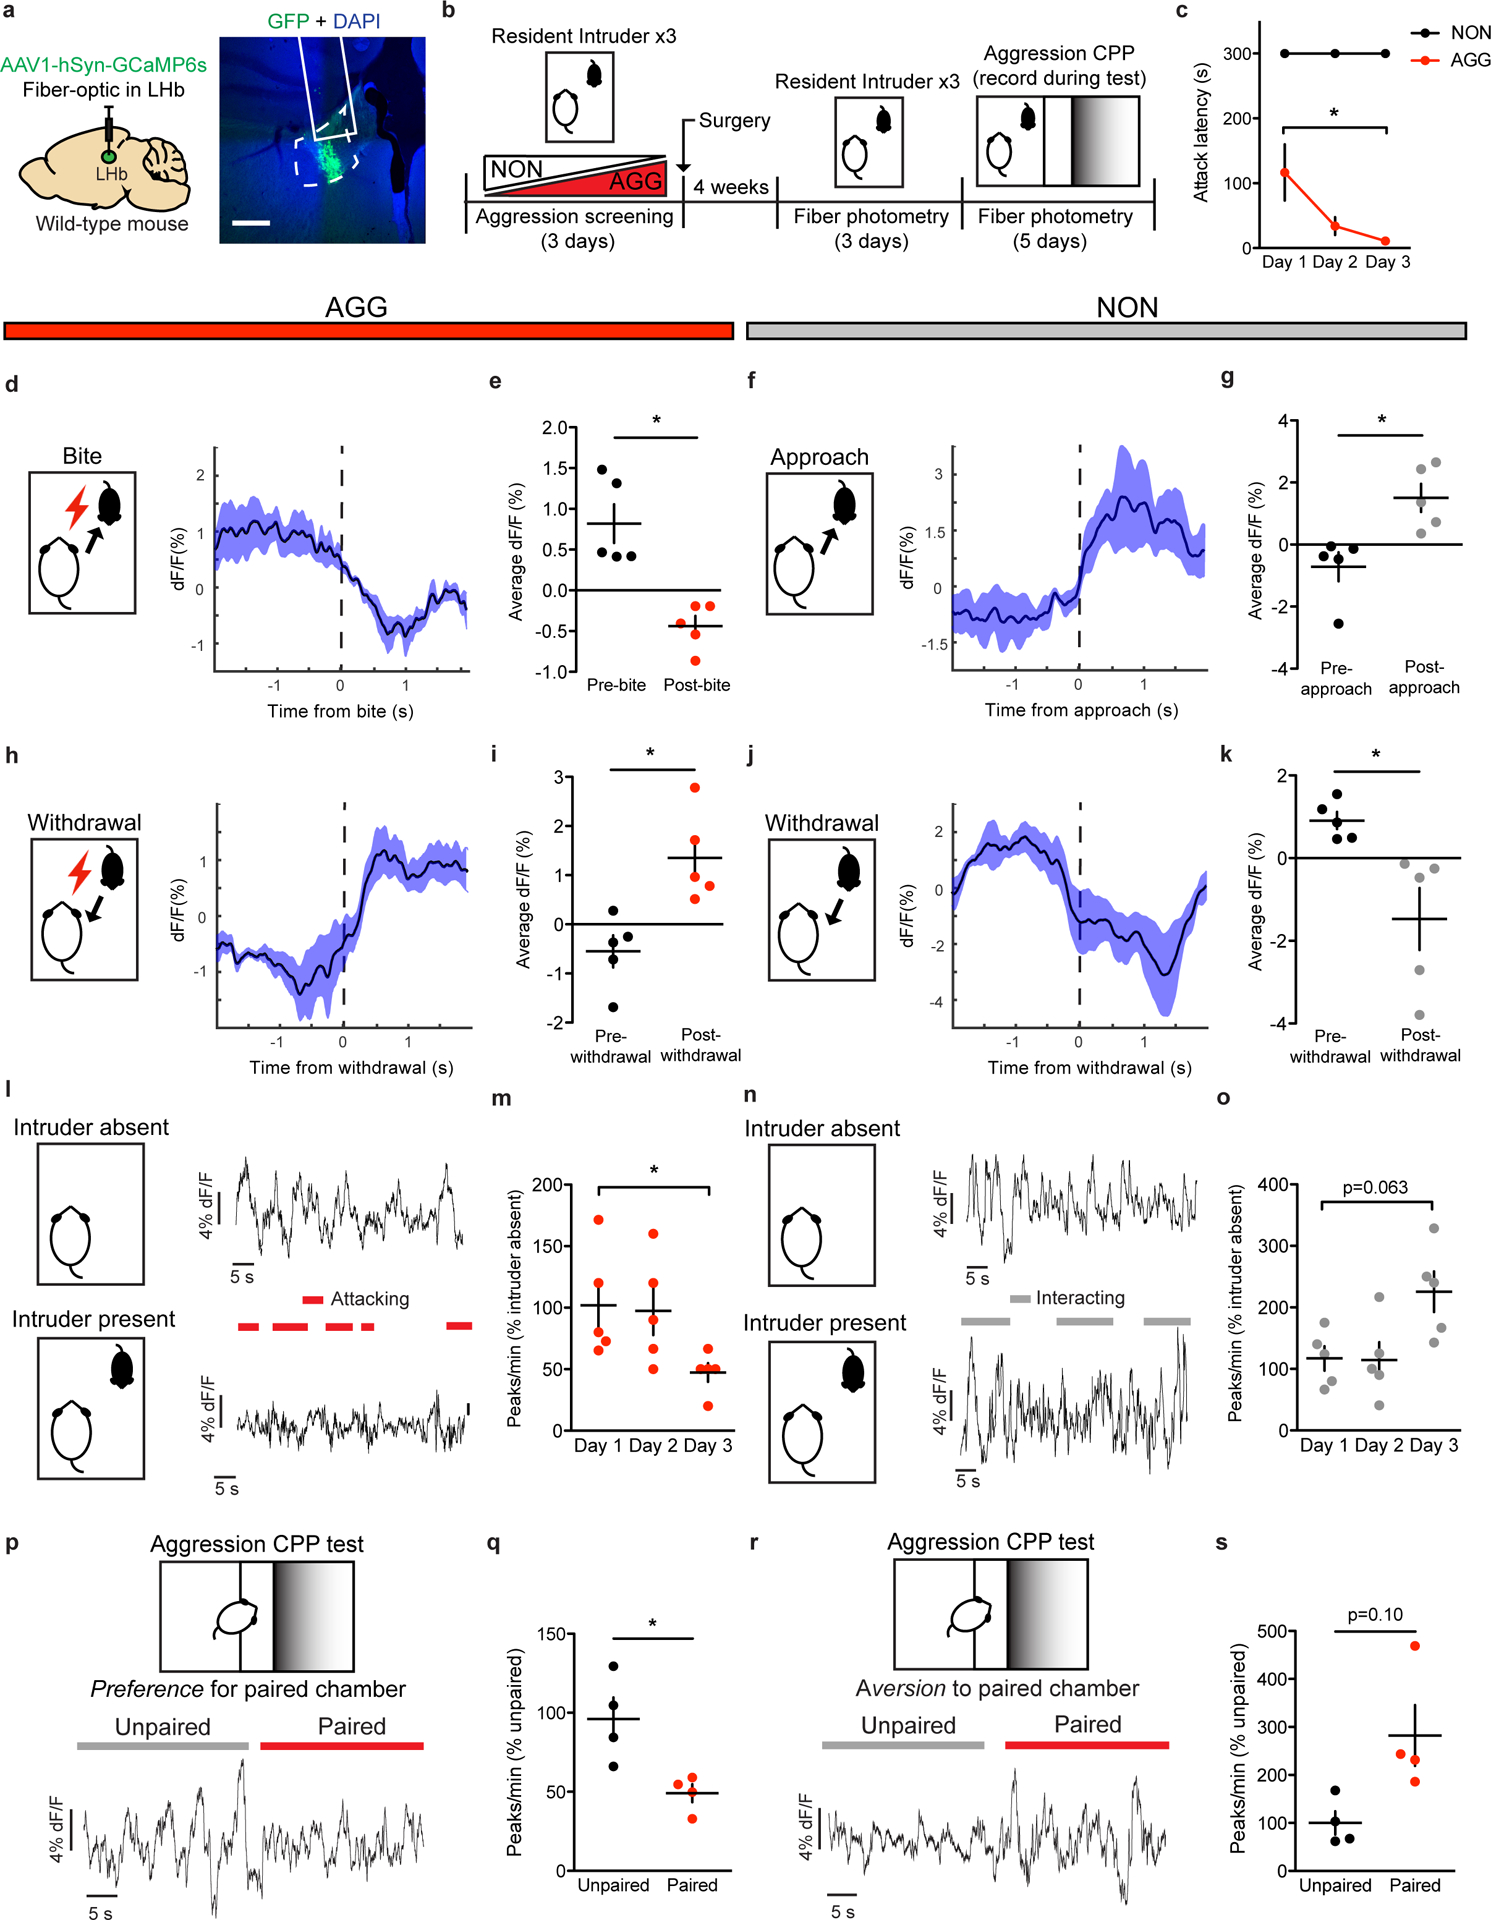
a, Surgical manipulations and representative viral infection for LHb photometry experiments, scale bar = 400 μm. b, Experimental timeline for LHb photometry experiments. c, AGGs displayed reduced attack latency on day 3 compared to day 1 of RI (one-way repeated measures ANOVA, n=5 AGGs, F(2,8)=74.832, main effect of day p=0.04832, Dunnett’s multiple comparisons test day 1 vs. day 3 adjusted p=0.0327). d, Peri-event plot of AGG LHb activity before and after a bite on day 3 of RI. For all peri-event plots, black line denotes the mean signals for all animals, while blue shaded region denotes the SEM, n=5 biologically independent mice, 3–5 bites per mouse. e, AGGs displayed a reduction in average LHb activity following a bite (two-tailed paired t-test, n=5 biologically independent mice, 3–5 bites per mouse, t(4)=4.593, p=0.0101). f, Peri-event plot of NON LHb activity before and after an intruder approach on day 3 of RI. Black line denotes the mean signals for all animals, while blue shaded region denotes the SEM, n=.5 biologically independent mice, 3–5 approaches per mouse. g, NONs displayed an increase in average LHb activity following an approach (two-tailed paired t-test, n=5 biologically independent mice, 3–5 approaches per mouse, t(4)=3.450, p=0.0261. h, Peri-event plot of AGG LHb activity before and after a withdrawal from an aggressive bout. Black line denotes mean signals for all animals while blue shaded region denotes the SEM, n=5 biologically independent mice, 3–5 withdrawals per mouse. i, AGGs displayed an increase in average LHb activity following a withdrawal (two-tailed paired t-test, n=5 biologically independent mice, 3–5 withdrawals per mouse, t(4)=3.911, p=0.0174. j, Peri-event plot of NON LHb activity before and after a withdrawal from a non-aggressive social interaction. Black line denotes mean signals for all animals while blue shaded region denotes the SEM, n=5 biologically independent mice, 3–5 withdrawals per mouse. k, NONs displayed a decrease in LHb activity after a withdrawal from a non-aggressive social interaction (two-tailed paired t-test, n=5 biologically independent mice, 3–5 withdrawals per mouse, t(4)=2.838, p=0.0470). l, Representative traces of AGG LHb activity in the absence and presence of an intruder mouse on day 3 of RI. m, AGGs displayed reduced LHb activity across three days of RI (one-way repeated measures ANOVA, n=5 biologically independent mice, F(2,8)=6.294, p=0.0228, Dunnett’s test for multiple comparisons, day 1 vs day 3 adjusted p=0.0228). n, Representative traces of NON LHb activity in the absence and presence of an intruder mouse on day 3 of RI. o, NONs displayed a trend towards increased LHb activity across 3 days of RI (one-way repeated measures ANOVA, n=5 mice, F(2,14)=3.985, p=0.0630). p, Representative trace of AGG LHb activity during the aggression CPP test. q, AGGs displayed reduced LHb activity in the paired context compared to the unpaired context during the aggression CPP test (two-tailed paired t-test, n=4 mice, t(3)=4.080, p=0.0266). r, Representative trace of NON LHb activity during the aggression CPP test. s, NONs displayed no differences in LHb activity in the paired context compared to the unpaired context during the aggression CPP test (paired t-test, n=4 mice, t(3)=2.352, p=0.1001). *p<0.05. All data are expressed as mean ± SEM.
Given that optogenetic inhibition of the LHb has been shown to promote aggression and aggression CPP9, we hypothesized that aggressive behaviors would be associated with reductions in LHb activity. Consistent with our hypothesis, AGGs displayed reductions in LHb activity upon biting an intruder (Fig. 1d–e). Conversely, NONs displayed increases in LHb activity upon intruder approaches (Fig. 1f–g). AGGs and NONs also displayed opposing LHb responses to withdrawals from social bouts, with AGGs showing increases in LHb activity upon withdrawals from aggressive social bouts and NONs showing decreases in LHb activity upon withdrawals from non-aggressive social bouts (Fig. 1h–k). Importantly, these LHb responses to social targets during RI in AGGs were observed on both day 1 of RI (Extended Data 1) and day 3 of RI (Fig. 1d–j). Over the 3 days of RI, AGGs increased their aggression towards the intruder, attacking with shorter latencies on day 3 than on day 1 (Fig. 1c). This is consistent with previous studies describing a phenomenon called “the winner effect,” whereby prior winning experience increases aggression towards future social targets27. Notably, the observed increase in aggression on day 3 of RI was associated with decreased LHb activity across the RI session compared to day 1 of RI (Fig. 1l–m). However, NONs only trended towards increased LHb activity across the RI session on day 3 compared to day 1 (p=0.08, Fig. 1n–o).
To determine whether the LHb is capable of encoding contextual information about the rewarding properties of aggressive social encounters, we next performed fiber photometry in AGGs and NONs during the test phase of aggression-CPP. We found that AGGs displayed reduced LHb activity in the paired context of the CPP chamber compared to the unpaired context (Fig. 1p–q). Similarly, NONs showed a trend towards increased LHb activity in the paired context of the CPP chamber compared to the unpaired context (p=0.10, Fig. 1r–s). In addition, CPP scores of AGGs and NONs were negatively correlated with LHb activity in the paired context (Extended Data 1). Together, these data indicate that the LHb is involved in encoding the rewarding properties of aggressive social interactions and the contexts associated with them.
Aggression is associated with increased LHb GAD2 neuron activity
Although the LHb consists predominantly of glutamatergic projection neurons expressing vGlut216, GAD2-expressing LHb cells have also been reported18. To confirm this, we performed in-situ hybridization (ISH) for GAD2 mRNA in the LHb (Fig. 2a). We found that GAD2 neurons make up ~18% of total LHb neurons and are localized primarily to the medial aspect of the LHb (Fig. 2b). To better understand the role of specific LHb cell types (i.e. GAD2 versus vGlut2) in aggressive behavior, we screened mice in RI and compared the number of Fos-positive GAD2 and vGlut2 nuclei in the LHb of AGGs and NONs (Fig. 2c–d). Following the last RI experience, both total Fos-positive nuclei and vGlut2 Fos-positive nuclei were reduced in AGGs compared to NONs (Fig. 2e–g). Interestingly, GAD2 Fos-positive nuclei were increased in AGGs compared to NONs (Fig. 2e–g), suggesting that these cells may be playing a role in regulating aggressive behavior.
Figure 2: Aggressive behaviors are associated with increased expression of Fos mRNA in GAD2 LHb neurons.
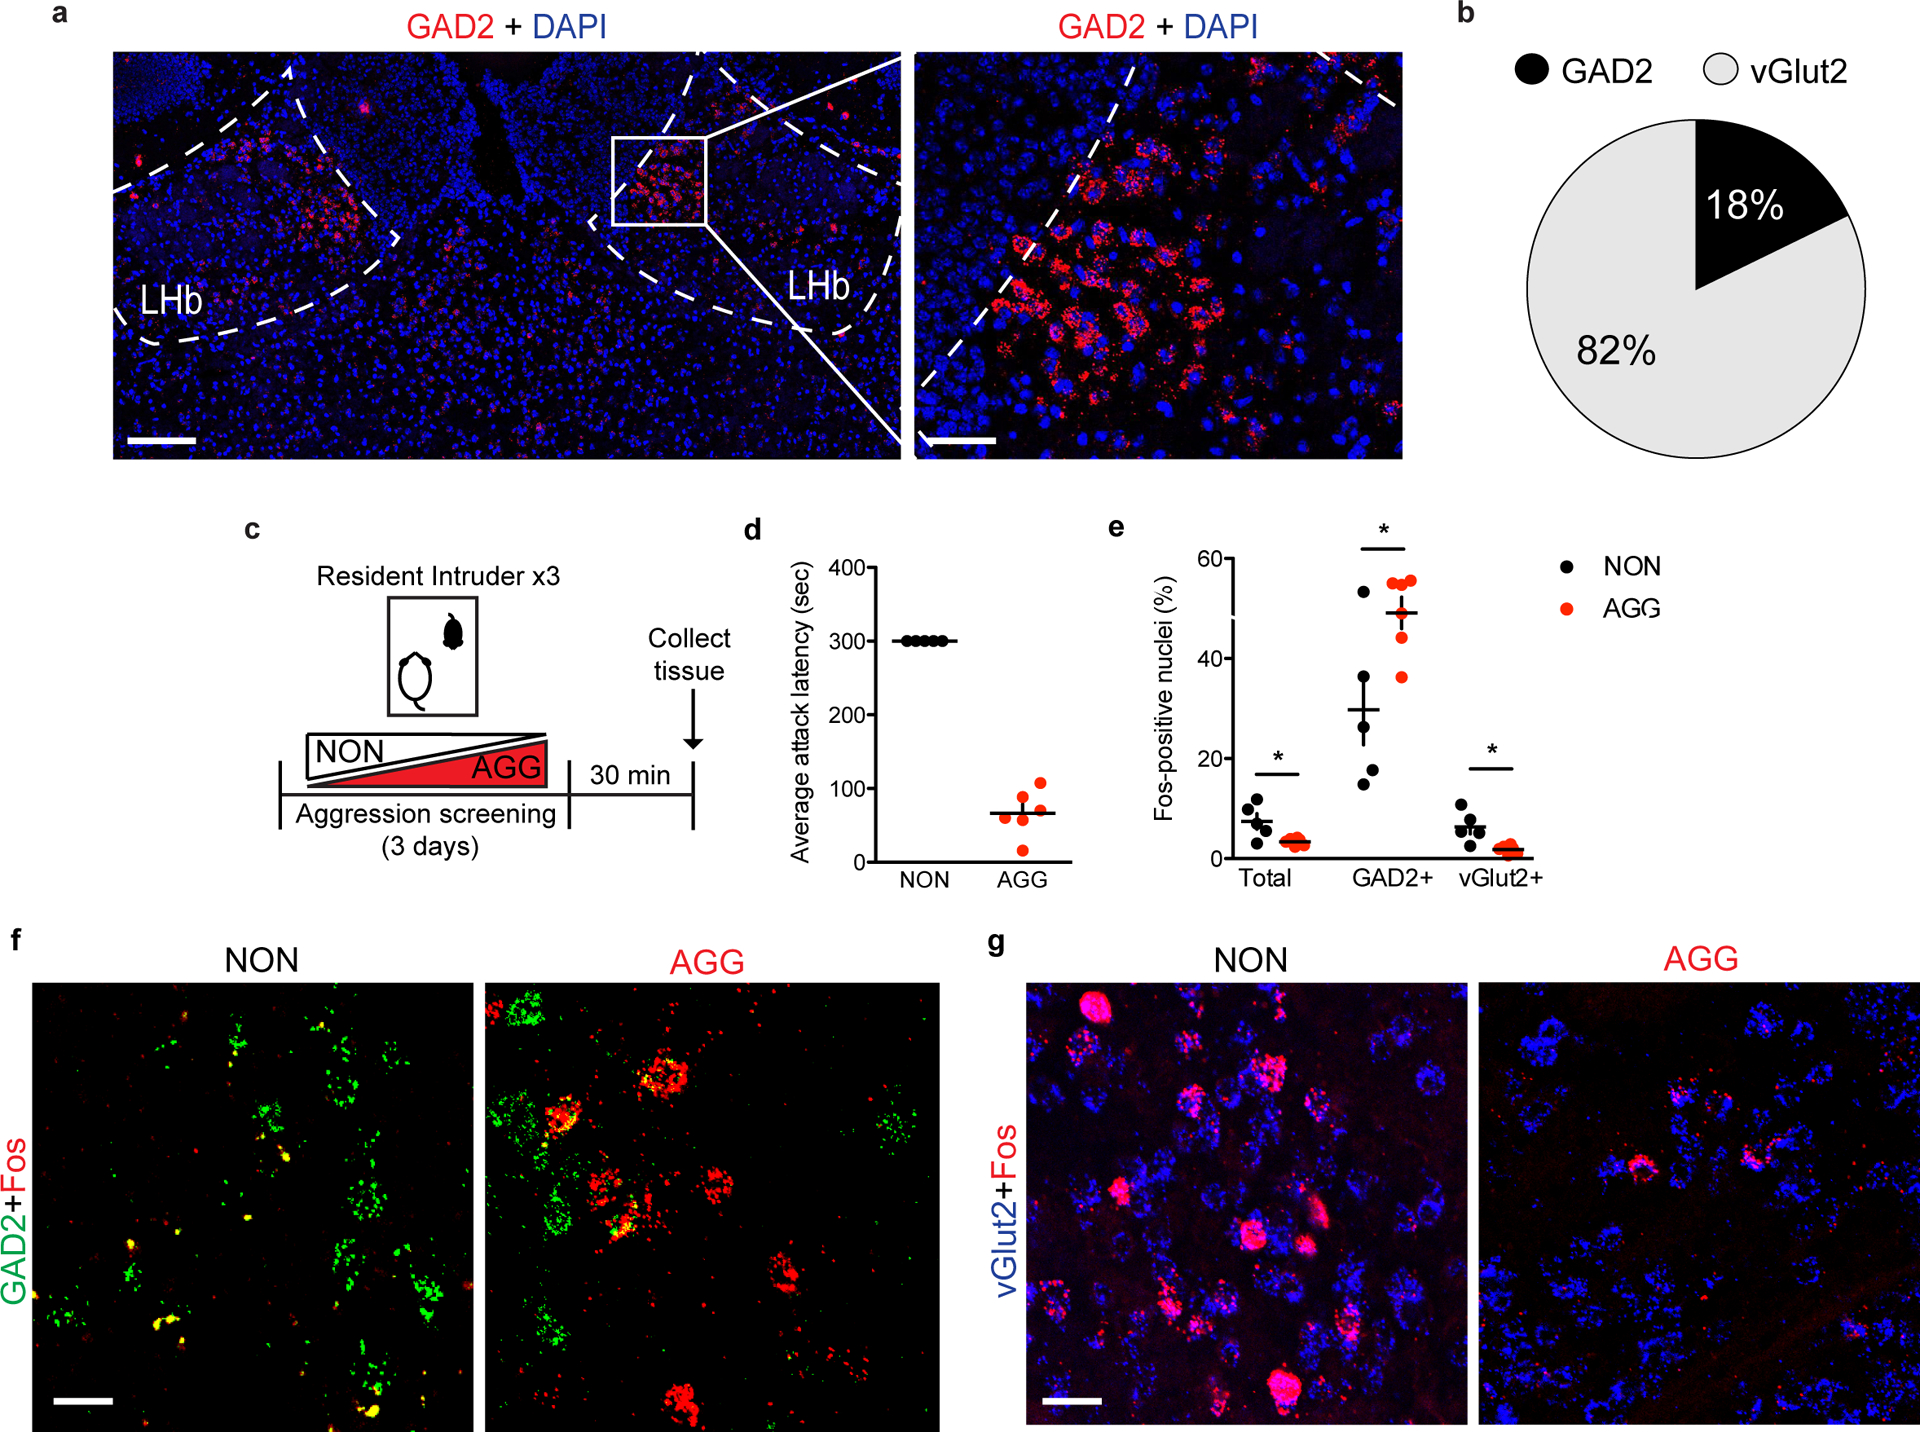
a, in-situ hybridization (ISH) for GAD2 in the LHb, left image scale bar=150 μm, right image scale bar=70 μm. Experimental images were taken from 3 biologically independent mice, 2 slices per mouse, with similar results obtained. b, Pie chart depicting percentage of LHb neuons that are positive for GAD2 or vGlut2 mRNA as determined by ISH, n=3 biologically independent mice. c, Experimental timeline for Fos in-situ hybridization (ISH) experiments. d, Average attack latency for NONs and AGGs over three days of RI screening, n=6 biologically independent mice. e, Fos-positive nuclei were lower in AGGs than in NONs for total and vGlut2-positive LHb neurons and higher in GAD2-positive LHb neurons (two-tailed student’s t-test, n=5 biologically independent NON mice, n=6 biologically independent AGG mice, 2 slices per mouse, total: t(9)=2.828, p=0.0198, vGlut2: t(9)=3.421, p=0.0176, GAD2: t(9)=2.686, p=0.025). f, Representative images of ISH in the LHb for Fos (red) and GAD2 (green) in NON and AGG mice following RI screening, scale bar=35 μm. Experimental images were obtained from 11 independent mice with two images taken per mouse, with similar results obtained. g, Representative images of ISH in the LHb for Fos (red) and vGlut2 (blue) in NON and AGG mice following RI screening, scale bars=35 μm. Experimental images were obtained from 11 independent mice with two images taken per mouse, with similar results obtained. *p<0.05. All data are expressed as mean ± SEM.
To assess the dynamics of GAD2 neurons in real-time, we used cell-type specific fiber photometry to record their activity during RI and aggression CPP (Fig. 3a–b). To do this, we injected AAV-Flex-GCaMP6 into the LHb of GAD2-Cre mice and implanted a fiber above the infected cells. AGGs displayed robust activation of GAD2 neurons around the time at which an aggressive interaction commenced (Fig. 3d–e), whereas GAD2 neuron activity decreased near the time at which they withdrew from an aggressive bout (Fig 3h–i). These responses were observed on both day 1 and day 3 of RI, and increases in overall GAD2 neuron activity coincided with increases in aggressive behavior (Fig. 3c,l–m, Extended Data 2). Interestingly, the activity of GAD2 neurons in NONs was only weakly associated with social behavior in RI (Fig. 3f–g, j–k, n–o), indicating that LHb responses to social targets in NONs may not be strongly driven by alterations in the activity of LHb GAD2 neurons. During the aggression-CPP test, AGGs displayed increased LHb GAD2 neuron activity in the aggression-paired context compared to the unpaired context (Fig. 3p–q). Though we did not observe any significant differences in LHb GAD2 neuron activity between the paired and unpaired chambers in NONs (Fig. 3r–s), LHb GAD2 neuron activity was correlated with aggression CPP score in both AGGs and NONs (Extended Data 2). Therefore, our findings imply that LHb GAD2 neurons are a sub-population within the LHb whose activity during aggression and exposure to aggression-associated contexts opposes that of the LHb as a whole.
Figure 3: Aggressive behaviors are associated with increased GAD2 LHb neuron activity.
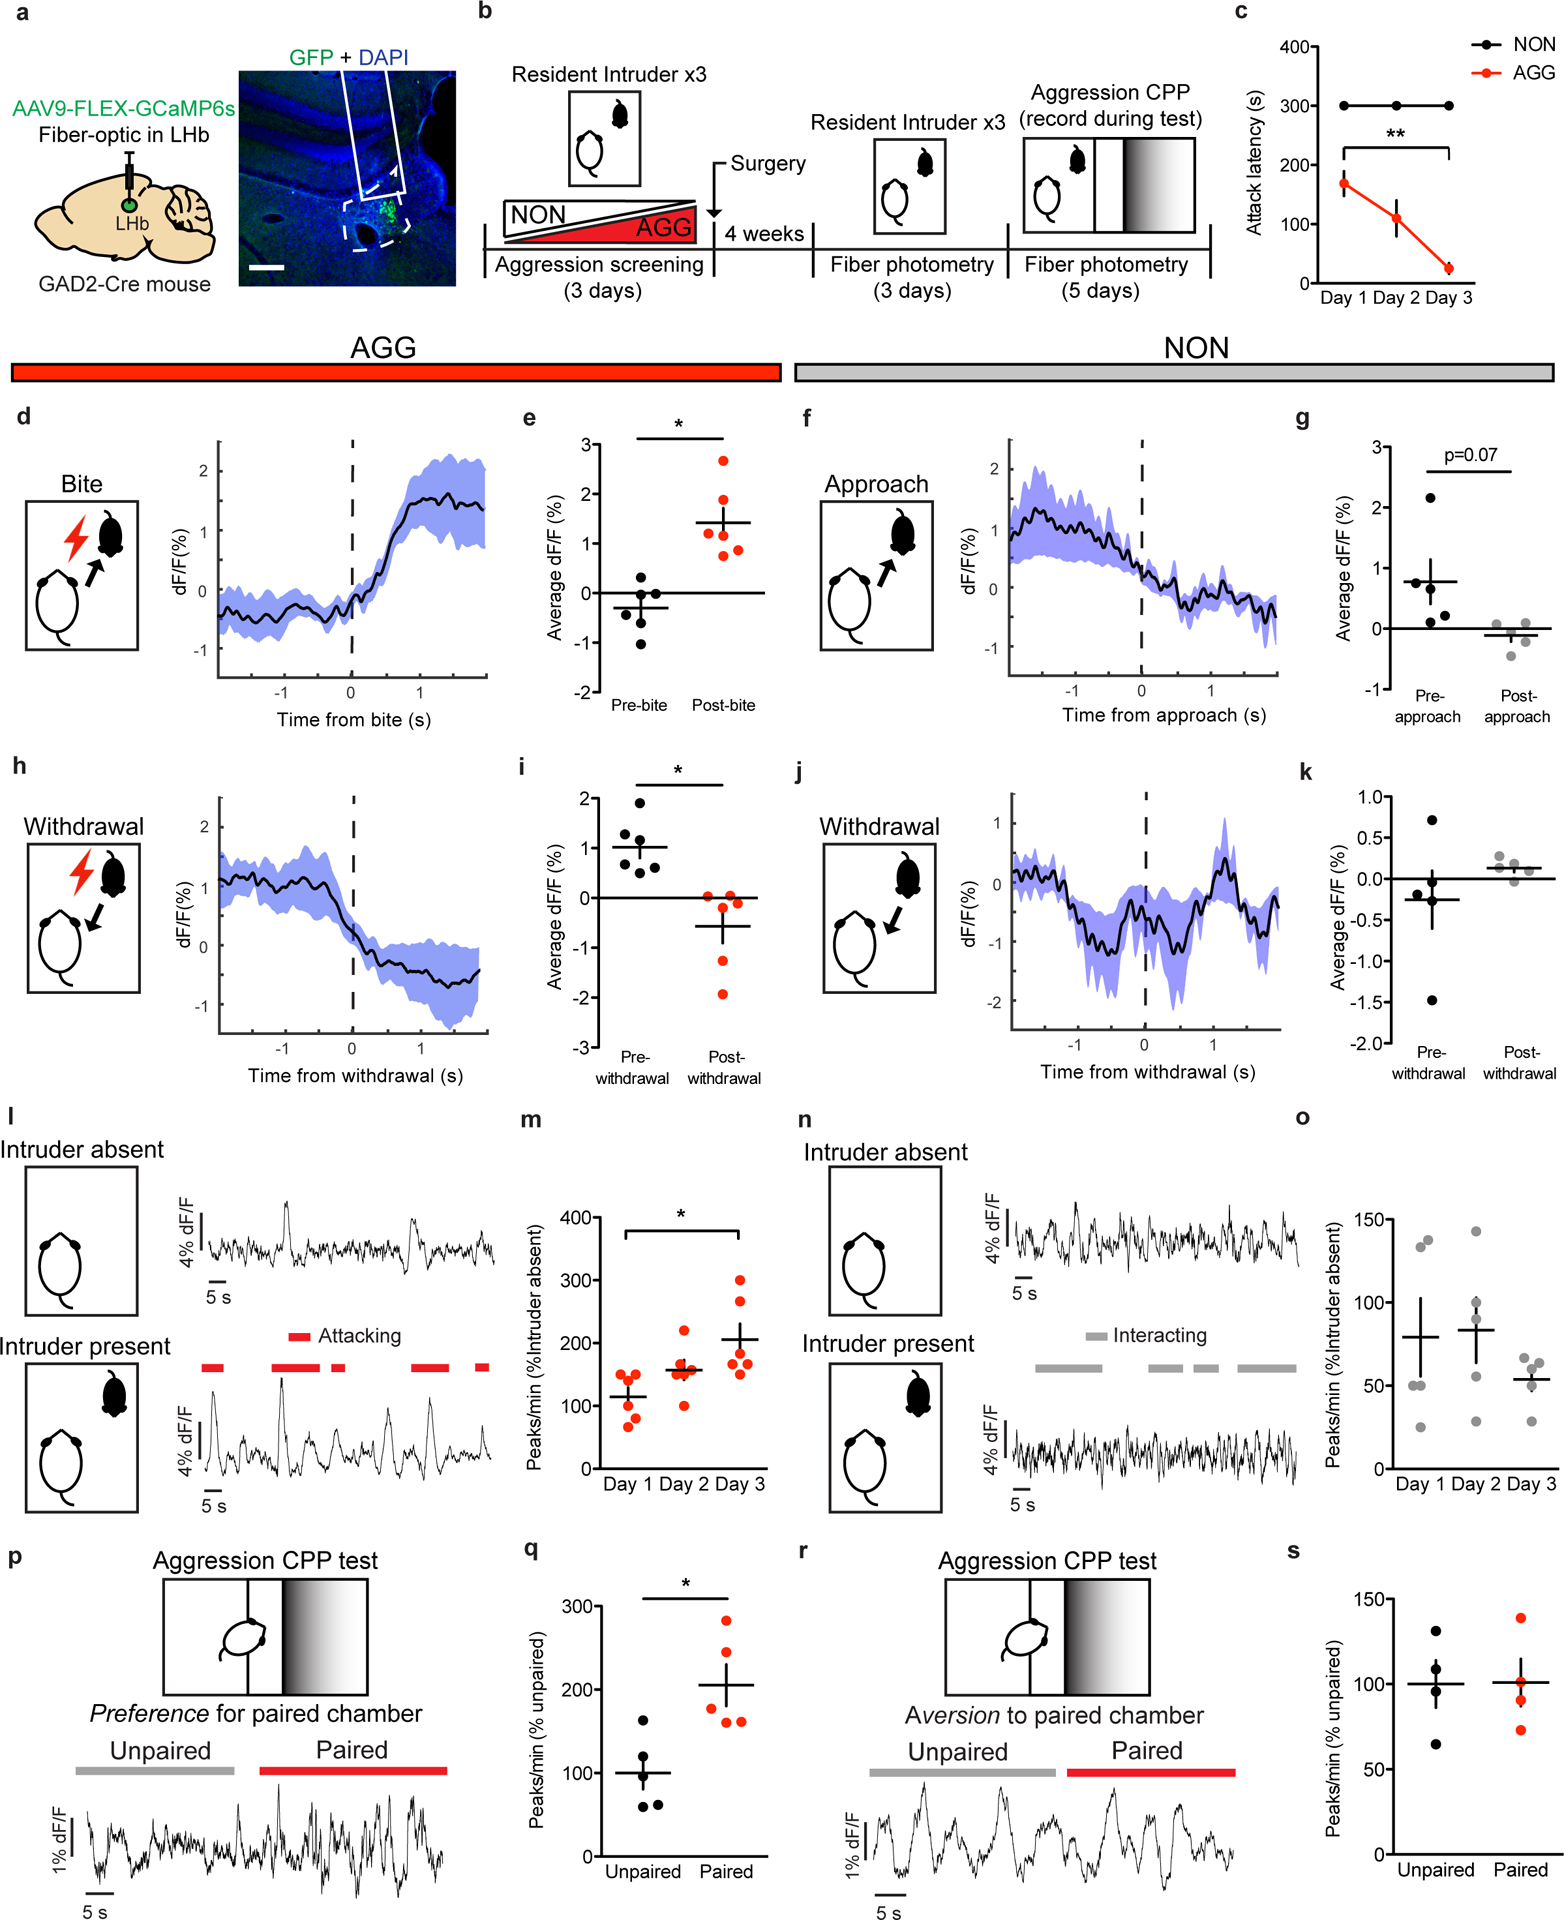
a, Surgical manipulations and representative viral infection for LHb GAD2 neuron photometry experiments, scale bar=400 μm. b, Experimental timeline for LHb GAD2 neuron photometry experiments. c, AGGs displayed reduced attack latency on day 3 of RI compared to day 1 of RI (one-way repeated measures ANOVA, n=5 biologically independent mice, F(2,10)=10.78, p=0.0032, main effect of day, Dunnett’s test for multiple comparisons, d1 vs d3 adjusted p=0.0018). d, Peri-event plot of AGG LHb GAD2 activity 2s before and after a bite on day 3 of RI. For all peri-event plots, black line denotes the mean signals for all animals, while blue shaded region denotes the SEM, n=5 biologically independent mice, 3–5 bites per mouse. e, AGGs displayed an increase in average GAD2 neuron activity following a bite (two-tailed paired t-test, n=5 biologically independent mice, 3–5 bites per mouse, t(5)=4.914, p=0.0044). f, Peri-event plot of NON LHb GAD2 neuron activity 2s before and after an intruder approach on day 3 of RI. Black line denotes mean signals for all animals, while blue shaded region denotes the SEM, n=5 biologically independent mice, 3–5 approaches per mouse. g, NONs displayed no change in average LHb activity following an approach (two-tailed paired t-test, n=5 mice, 3–5 approaches per mouse, t(4)=2.437, p=0.0714. h, Peri-event plot of AGG LHb GAD2 neuron activity 2s before and after a withdrawal from an aggressive bout. Black line denotes mean signals for all animals while blue shaded region denotes the SEM, n=6 biologically independent mice, 3–5 withdrawals per mouse. i, AGGs displayed a decrease in average LHb activity following a withdrawal (two-tailed paired t-test, n=6 mice, 3–5 withdrawals per mouse, t(5)=3.022, p=0.0294. j, Peri-event plot of NON LHb GAD2 neuron activity 2s before and after a withdrawal from a non-aggressive social interaction. Black line denotes mean signals for all animas while blue shaded region denotes the SEM, n=5 biologically independent mice, 3–5 withdrawals per mouse. k, NONs displayed no change in LHb GAD2 neuron activity after a withdrawal from a non-aggressive social interaction (two-tailed paired t-test, n=5 biologically independent mice, 3–5 withdrawals per mouse, t(4)=1.170, p=0.3068). l, Representative traces of AGG LHb GAD2 neuron activity in the absence and presence of an intruder mouse during day 3 of RI. m, AGGs displayed increased GAD2 LHb activity across three days of RI (one-way repeated measures ANOVA, n=6 biologically independent mice, F(2,10)=5.653, p=0.0228, Dunnett’s multiple comparisons test day 1 vs. day 3 adjusted p=0.0133) n, Representative traces of NON LHb GAD2 neuron activity in the absence and presence of an intruder mouse during day 3 of RI. o, NONs did not display changes in LHb GAD2 neuron activity across three days of RI (one-way repeated measures ANOVA, n=5 mice, F(2,14)=0.8904, p=0.4476). p, Representative trace of AGG LHb GAD2 neuron activity during the aggression CPP task. q, AGGs displayed increased LHb GAD2 neuron activity in the paired context compared to the unpaired context during the aggression CPP task (two-tailed paired t-test, t(4)=2.885, p=0.0448). r, Representative trace of NON LHb GAD2 neuron activity during the aggression CPP task. s, NONs did not display differences in LHb GAD2 neuron activity during the aggression CPP task (two-tailed paired t-test, t(3)=0.03591, p=0.9736). *p<0.05, **p<0.01. All data are expressed as mean ± SEM.
Optogenetic manipulation of LHb GAD2 neurons influences aggression
Though LHb GAD2 neurons have been reported to express GABA as well as the vesicular GABA transporter (vGAT)18, it remains unknown whether these neurons promote local inhibition within the LHb, outside of the LHb, or both. To assess whether LHb GAD2 neurons can provide local inhibition, we transduced LHb GAD2 neurons with channel-rhodopsin (ChR2) by injecting AAV-DIO-ChR2 into the LHb of GAD2-Cre mice and applied blue light to brain slices containing the LHb while recording from putative LHb vGlut2 neurons using whole-cell electrophysiology (Fig. 4a). We found that optogenetic stimulation of LHb GAD2 neurons in slice elicited monosynaptic inhibitory currents in non-GAD2 (vGlut2) neurons that were completely blocked with the GABA receptor antagonist picrotocxin (Fig. 4b–c). We did not detect excitatory currents in any neurons as a result of GAD2 neuron optogenetic stimulation, as evidenced from a lack of responses when holding neurons at −70 mV. Moreover, DREADD-mediated activation of LHb GAD2 neurons in-vivo reduced the total number of putative non-GAD2 Fos-positive neurons in the LHb (Fig. 4d–g). Together, these data provide the first evidence of a functional inhibitory microcircuit within the LHb and challenge the longstanding notion that the LHb is devoid of local sources of inhibition. To test whether LHb GAD2 neurons project outside of the LHb, we performed anterograde tracing of their projections by injecting AAV-DIO-eYFP into the LHb of GAD2-Cre mice. We did not observe evidence of eYFP-positive axons in primary known LHb target regions like the ventral tegmental area (VTA), the dorsal raphe nucleus (DRN), the median raphe nucleus (MRN), or the rostromedial tegmental nucleus (RMTg) (Extended Data 3). These results suggest that LHb GAD2 neurons are capable of inhibiting neurons within the LHb itself and may not directly target neurons in the major downstream regions of LHb efferents.
Figure 4: GAD2 LHb neurons are locally inhibitory and regulate aggressive behaviors in AGGs.
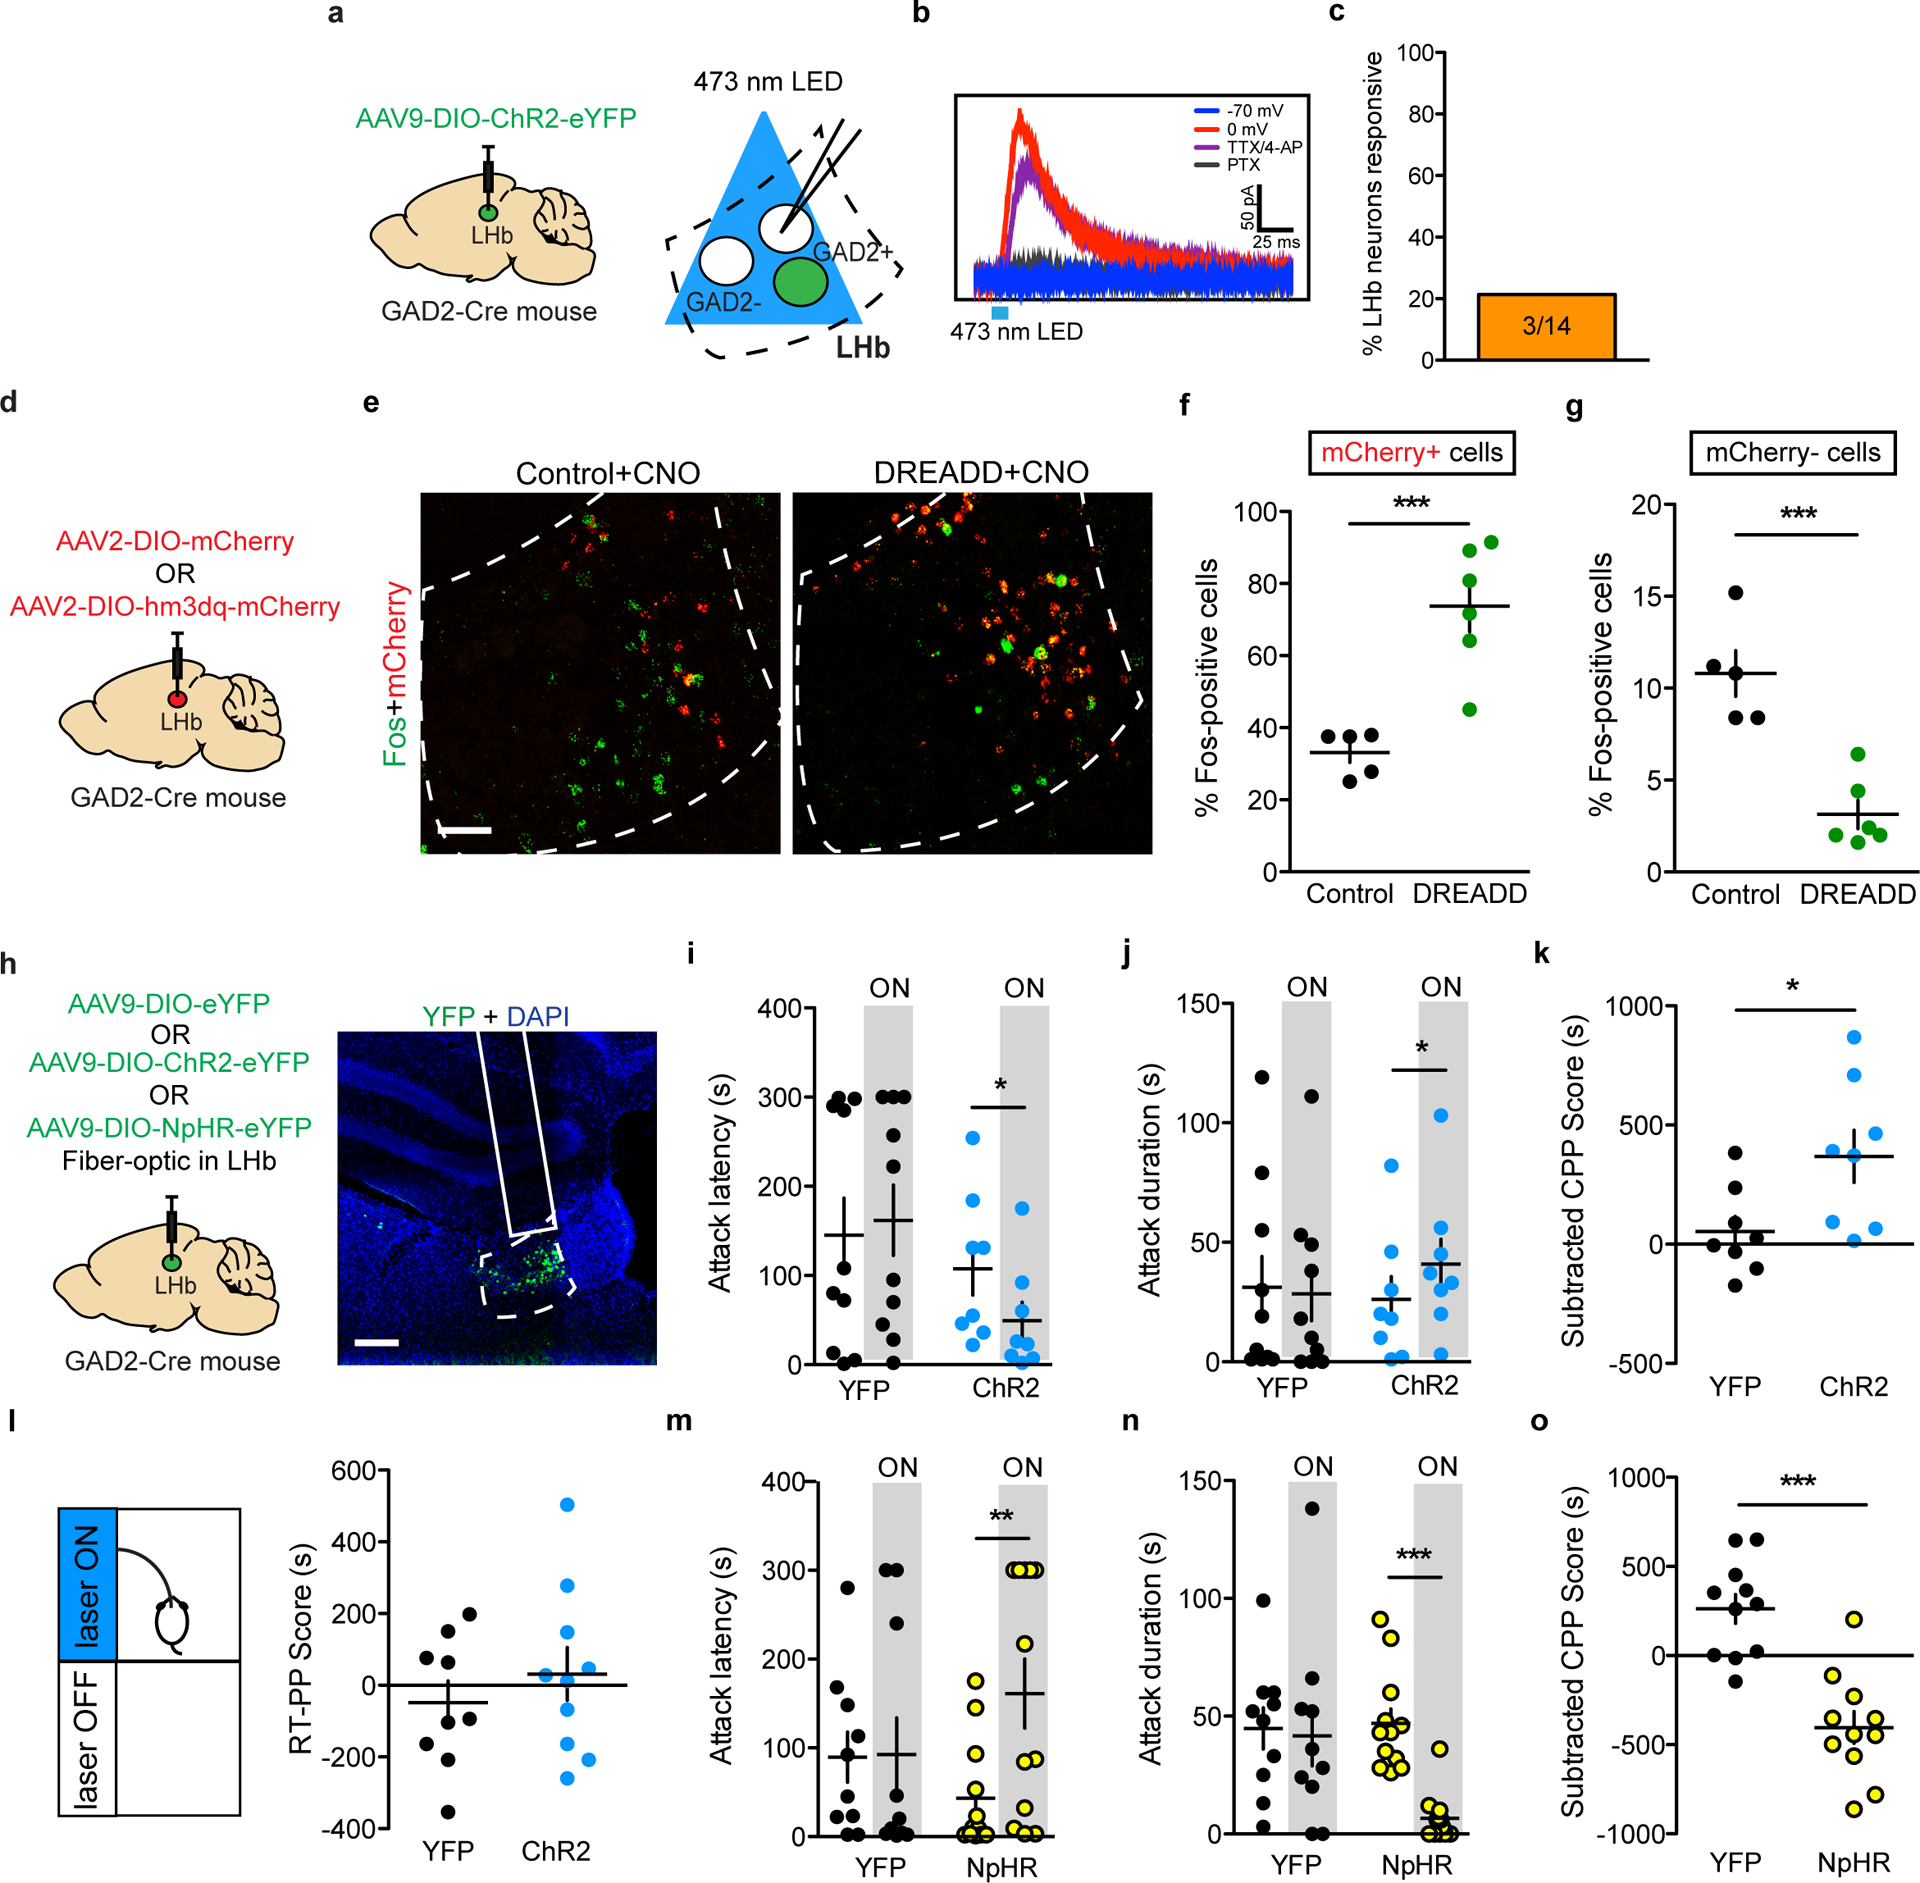
a, Surgical manipulations and experimental schematic for slice optogenetic stimulation of GAD2 LHb neurons. b, Representative trace of GFP-negative neuron in response to optogenetic stimulation of nearby GAD2 neurons when cells are held at 0 mV or −70 mV and in the presence of TTX or the GABA receptor antagonist picrotoxin. c, Percent LHb GFP-negative neurons responding to optogenetic stimulation of GAD2 neurons. d, Surgical manipulations for GAD2 DREADD experiments. e, Representative images of ISH for Fos (green) and mCherry (red) mRNA in control and DREADD mice following treatment with CNO, scale bar= 50μm. f, CNO treatment increased the percent of Fos-expressing mCherry-positive neurons in DREADD mice compared to controls (two-tailed student’s t-test, n=5 biologically independent mice per group, t(9)=4.905, p=0.0008). g, CNO treatment reduced the percent of Fos-expressing mCherry-negative neurons in DREADD mice compared to controls (two-tailed student’s t-test, n=5 biologically independent mice per group, t(9)=5.439, p=0.0004). h, Surgical manipulations and representative viral infection image for in-vivo GAD2 LHb neuron optogenetics experiments, scale bar= 300μm i, ChR2-mediated stimulation of GAD2 LHb neurons reduced attack latency in RI (two-taile paired t-test, n=8 biologically independent mice, t(7)=3.724, p=0.0136). j, ChR2-mediated stimulation of LHb neurons increased attack duration in RI (paired t-test, n=8 mice, t(7)=2.690, p=0.0311). k, ChR2-mediated stimulation of GAD2 LHb neurons increased aggression CPP (two-tailed student’s t-test, n=8 biologically independent mice per group, t(14)=2.482, p=0.0264). l, Stimulation of GAD2 LHb neurons did not induce a real-time place preference (two-tailed student’s t-test, n=9 biologically independent mice per group, t(17)=0.8271, p=0.4196). m, NpHr-mediated inhibition of GAD2 LHb neurons increased attack latency in RI (two-tailed paired t-test, n=12 biologically independent mice, t(11)=3.242, p=0.0078). n, NpHr-mediated inhibition of GAD2 LHb neurons reduced attack duration in RI (two-tailed paired t-test, n=12 mice, t(11)=5.504, p=0.002). o, NpHr-mediated inhibition of GAD2 LHb neurons reduced aggression CPP (two-tailed student’s t-test, n=11 mice per group, t(20)=5.517, p<0.0001). *p<0.05, **p<0.01, ***p<0.001. All data are expressed as mean ± SEM.
To determine whether LHb GAD2 neurons play a functional role in aggressive behavior, we performed in-vivo optogenetic manipulation of LHb GAD2 neurons during RI and the aggression CPP test (Fig. 4h). To do this, we injected AAV-DIO-ChR2 (channel-rhodopsin) or AAV-DIO-eYFP into the LHb of GAD2-Cre mice and implanted a fiber above the LHb. We found that optogenetic activation of GAD2 LHb neurons with ChR2 in AGG mice (20 Hz, 20 ms pulses, 7mW) reduced the latency to attack and increased the total duration of time spent attacking in RI (Fig. 4i–j). Notably, we were unable to elicit aggression in NONs with optogenetic stimulation of GAD2 neurons (Extended Data 4). Optogenetic activation of GAD2 LHb neurons in AGGs during the aggression CPP test also increased the time spent in the intruder-paired context (Fig. 4k). However, stimulation of GAD2 neurons did not elicit a real-time place preference (RTPP) (Fig. 4l) or promote CPP for palatable food (Supplementary Figure 1). These data imply that GAD2 neurons potentiate aggression by enhancing its rewarding properties, but do not modulate food reward or general reward-like responding. Consistent with these findings, consumption of palatable food did not alter the activity of LHb GAD2 neurons as determined using fiber photometry and the calcium sensor GCaMP6 (Supplementary Figure 1).
To determine if LHb GAD2 neurons are necessary for aggression, we tested whether optogenetic inhibition of them reduces aggression and aggression CPP. To do this, we injected AAV-DIO-NpHR (halo-rhodopsin) or AAV-DIO-eYFP into the LHb of GAD2-Cre mice and implanted a fiber above the LHb. Though this did not completely block aggression, optogenetic inhibition of GAD2 LHb neurons in AGGs (constant light, 8s on/2s off, 7 mW) increased the latency to attack and decreased the total duration of time spent attacking in RI (Fig. 4m–n). Optogenetic inhibition of LHb GAD2 neurons also promoted aversion for the intruder-paired context during aggression CPP (Fig. 4o). Together, these results indicate that LHb GAD2 neurons can alter the valence of aggressive social interactions and subsequently, the intensity of aggression itself.
Orexin modulates LHb GAD2 neurons
Though little is currently known about LHb GAD2 neurons, reports suggest they express several hypothalamus-derived neuropeptide and hormone receptors, including OxR217, 18. Orexin has not been previously implicated in aggression, but has been implicated in various motivated behaviors, from drug addiction to social interaction25–29. Therefore, we hypothesized that orexin-mediated activation of LHb GAD2 neurons via OxR2 would promote aggressive behavior. First, we characterized the expression of OxR2 in the LHb by performing double fluorescent in situ hybridization (ISH) for OxR2 in GAD2 and vGlut2 neurons (Fig. 5a). We detected expression of OxR2 in nearly 100% of LHb GAD2 neurons, while fewer than 10% of LHb vGlut2 neurons were positive for OxR2 (Fig. 5b–c). To visualize orexin-positive axons in the LHb and their proximity to LHb GAD2 neurons, we utilized the high-resolution microscopy technique AiryScan in conjunction with viral-mediated fluorescent labeling (AAV-DIO-GFP in GAD2-Cre mice) of GAD2 cells and immunohistochemistry (IHC) to visualize orexin axons. Following 3D rendering of the images, we observed orexin axons that were closely apposed to GAD2 cell bodies and processes (Extended Data 5). To functionally test the hypothesis that orexin modulates the activity of GAD2 neurons, we bath-applied orexin to ex-vivo brain slices containing the LHb. We found that this increased the firing rate of GAD2 neurons, indicating that they are indeed physiologically activated by orexin (Fig. 5d–f).
Figure 5: Characterization of an LHb orexin circuit.
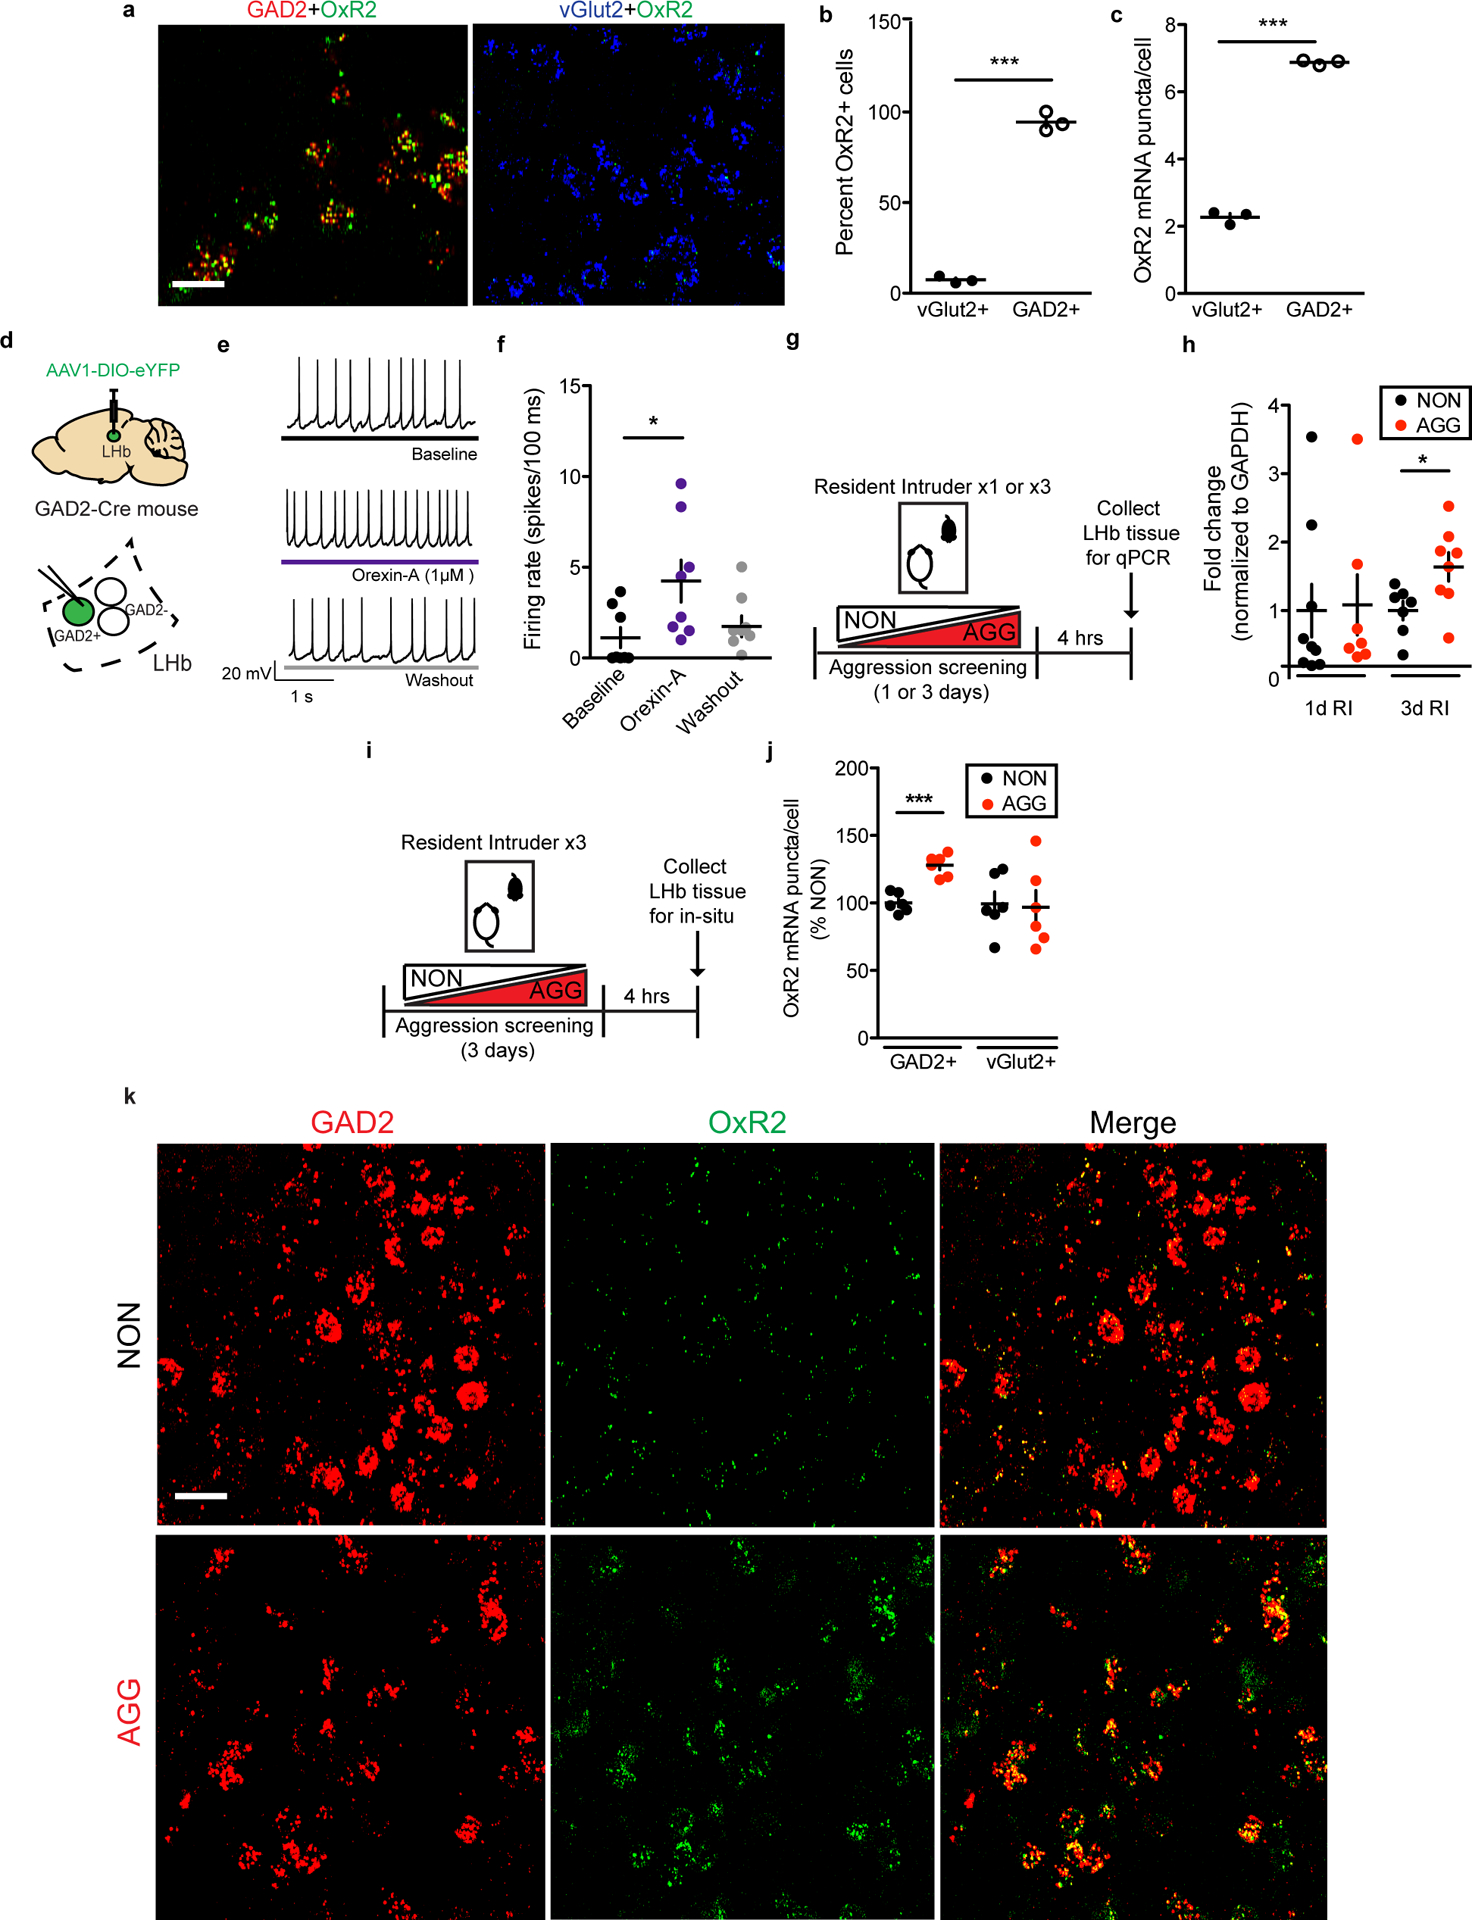
a, Representative in-situ hybridization (ISH) images showing OxR2 expression in GAD2 and vGlut2 LHb neurons, scale bar=20 μm. b, OxR2 is expressed primarily in GAD2 neurons compared to vGlut2 neurons (two-tailed student’s t-test, n=3 biologically independent mice, 1–2 slices per mouse, t(4)=15.67, p<0.0001). c, GAD2 neurons express more OxR2 mRNA than vGlut2 neurons (two-tailed student’s t-test, n=3 biologically independent mice, 1–2 slices per mouse, t(4)=15.67, p<0.0001). d, Surgical manipulations and experimental schematic for orexin bath application experiments. e, Representative traces from a GFP-positive neuron (GAD2 neuron) during baseline (top), orexin-A (middle), and washout (bottom) conditions. f, Orexin bath application increased the firing rate of GFP-positive neurons (Kruskal-Wallis one-way ANOVA with repeated measures, n=6 biologically independent mice, n=9 cells, Kruskall-Wallis statistic=7.115, p=0.0285, Dunn’s multiple comparisons baseline vs. orexin-A, adjusted p=0.0456). g, Experimental timeline for LHb qPCR experiments. h, Following 3 days of RI, AGGs expressed significantly more LHb OxR2 mRNA than NONs (3 days RI: two-tailed student’s t-test, n=7 biologically independent NON mice, n=8 biologically independent AGG mice, t(13)=2.496, p=0.0268; 1 day RI: two-tailed student’s t-test, n=9 biologically independent NON mice, n=7 biologically independent AGG mice, t(14)=0.1433, p=0.881). i, Experimental timeline for OxR2 ISH experiments. j, Following 3 days of RI, AGGs displayed increased GAD2 neuron OxR2 mRNA compared to NONs (two-tailed student’s t-test, n=5 biologically independent NON mice, n=6 biologically independent AGG mice, GAD2 neurons: t(9)6.039, p=0.0002; vGlut2 neurons: t(9)=0.6735, p=0.5175). k, Representative images of ISH for OxR2, GAD2, in AGGs and NONs following 3 days of RI, scale bar=20 μm. Experimental images were obtained from 11 independent mice with two slices imaged per mouse, with similar results obtained. *p<0.05, ***p<0.001 All data are expressed as mean ± SEM.
To investigate whether LHb OxR2 signaling is implicated in aggression, we screened mice in RI, categorized them as either AGGs or NONs, and collected LHb tissue to perform qPCR for Hcrt2r, the transcript encoding OxR2. We found that following three days of RI, AGGs displayed increased OxR2 expression compared to NONs (Fig. 5g–h, Extended Data 6). We did not observe this increase following one day of RI, suggesting that LHb OxR2 expression increases as a consequence of repeated aggression in RI. Next, we used ISH to label OxR2 mRNA in LHb GAD2 and vGlut2 neurons in AGGs and NONs following 3 days of RI. This was necessary to verify that OxR2 expression increased in GAD2 LHb neurons and to control for the possibility of extra-LHb tissue contamination of tissue punches in our qPCR experiments. As expected, we detected increased OxR2 expression in AGGs compared to NONs specifically in GAD2 neurons, with no change in vGlut2 neuron OxR2 expression (Fig. 5i–k, Extended Data 6). These data provide support for a model whereby increased orexin signaling in LHb GAD2 neurons as a consequence of repeated aggression experience promotes aggression and its rewarding properties, possibly through increased local inhibition of LHb principal neurons.
Manipulation of orexin signaling in the LHb influences aggression
In order to assess the effects of orexin on the activation of GAD2 and vGlut2 neurons in the LHb in-vivo, we optogenetically stimulated orexin terminals in the LHb of orexin-Cre mice injected with AAV-DIO-ChR2 in the LH and performed ISH for Fos and GAD2 or vGlut2 (Fig. 6a). Optogenetic stimulation of orexin terminals in the LHb (20 Hz, 20 ms pulses, 7mW for 30 minutes) reduced total LHb Fos expression as well as Fos expression in vGlut2-positive LHb neurons, whereas it increased Fos expression in GAD2 neurons compared to mice that received the AAV-DIO-eYFP control virus (Fig. 6b–d). Consistent with a decrease in overall Fos expression observed in the LHb following orexin terminal stimulation, systemic administration of selective OxR2 antagonist N-Ethyl-2-[(6-methoxy-3-pyridinyl)[(2-methylphenyl)sulfonyl]amino]-N-(3-pyridinylmethyl)-acetamide (EMPA; 30 mg/kg, intraperitoneal) increased the activity of the LHb as measured by fiber photometry in mice expressing a non-conditional AAV-GCaMP6 in the LHb (Extended Data 7). It also reduced aggression and aggression-CPP, without affecting locomotion or anxiety-like behavior (Extended Data 7). Together, these results provide further support for our model and suggest that locally-inhibitory LHb GAD2 neurons are activated by orexin from the LH.
Figure 6: Optogenetic manipulation of orexin inputs to the LHb modulates aggressive behavior in AGGs.
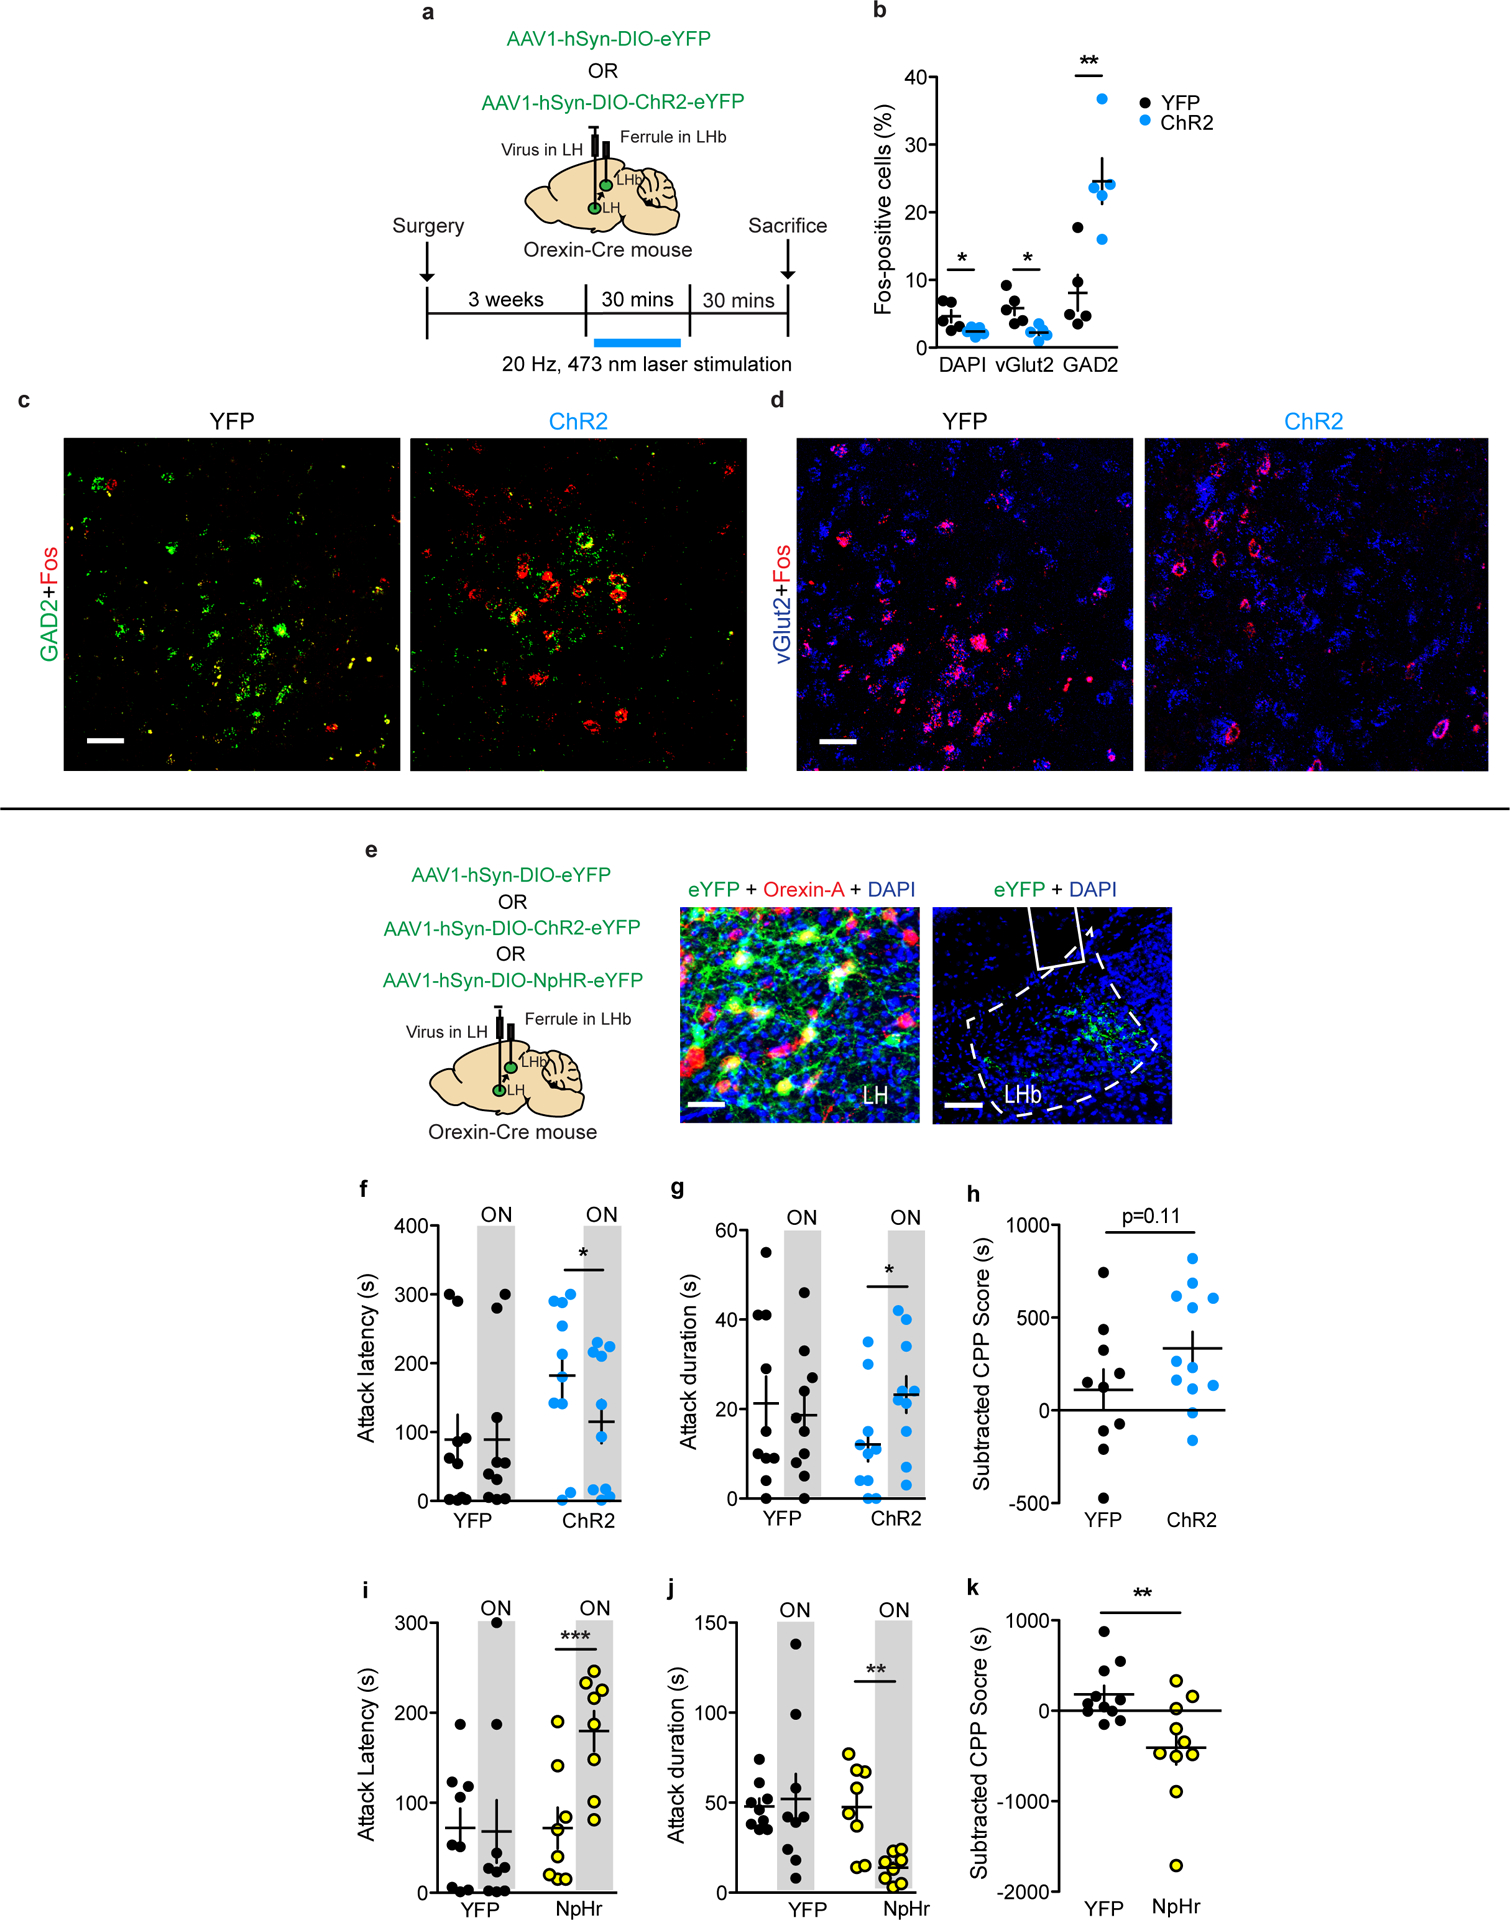
a, Surgical manipulations and experimental timeline for optogenetic stimulation of orexin terminals in the LHb followed by in-situ hybridization (ISH) for Fos, GAD2, and vGlut2. b, Optogenetic stimulation of orexin terminals in the LHb increased Fos in GAD2 neurons and decreased Fos in vGlut2 neurons and DAPI positive cells (two-tailed student’s t-test, n=5 biologically independent mice per group, 2 slices per mouse; GAD2: t(8)=3.854, p=0.0048; vGlut2: t(8)=3.236, p=0.0120; DAPI: t(8)=2.340, p=0.0475). c, Representative images of Fos expression in LHb GAD2 neurons from YFP and ChR2 mice, scale bar=40 μm. Experimental images were obtained from 10 mice, 2 slices per mouse, with similar results obtained. d, Representative images of Fos expression in LHb vGlut2 neurons from YFP and ChR2 mice, scale bar=40 μm. Experimental images were obtained from 10 mice, 2 slices per mouse, with similar results. e, Surgical manipulations and representative viral infection images for optogenetic manipulation of orexin terminals in the LHb, scale bar=150 μm. f, Optogenetic stimulation of orexin terminals reduced attack latency in RI (NpHr, two-tailed paired t-test, n=10 biologically independent mice, t(9)=2.354, p=0.043). g, Optogenetic stimulation of LHb orexin terminals increased attack duration in RI (NpHr, two-tailed paired t-test, n=10 biologically independent mice, t(9)=2.335, p=0.0444). h, Optogenetic stimulation of LHb orexin terminals did not significantly increase aggression CPP (two-tailed student’s t-test, n=10 biologically independent mice per group, t(18)=1.642, p=0.1140). i, Optogenetic inhibition of LHb orexin terminals increased attack latency in RI (NpHr, two-tailed paired t-test, n=8 biologically independent mice, t(7)=6.671, p=0.0003). j, Optogenetic inhibition of LHb orexin terminals reduced attack duration in RI (NpHr, two-tailed paired t-test, n=8 biologically independent mice, t(7)=4.252, p=0.0038). k, Optogenetic inhibition of LHb orexin terminals reduced aggression CPP (two-tailed student’s t-test, n=11 YFP, n=10 NpHr, t(19)=2.993, p-0.0085). * p<0.05, ** p<0.01, ***p<0.001. All data are expressed as mean ± SEM.
Next, we tested whether orexin inputs to the LHb play a functional role in aggression and aggression reward. To do this, we injected AAV-DIO-ChR2 into the LH of orexin-Cre mice and implanted a fiber above the LHb (Fig. 6e). Optogenetic stimulation of orexin terminals in the LHb (20 Hz, 20 ms pulses, 7mW) promoted aggression and modestly increased aggression-CPP in AGGs (Fig. 6f–h). However, optogenetic stimulation of orexin inputs to the LHb was not sufficient to initiate aggression in NONs (Extended Data 4). To confirm that these behavioral effects in AGGs were mediated by OxR2, we performed optogenetic stimulation of LHb orexin terminals in mice expressing a microRNA against OxR2 (AAV-miR-OxR2) in the LHb. Stimulation of LHb orexin terminals under these conditions did not alter aggressive behavior (Extended Data 8). To determine whether inhibition of orexin terminals in the LHb reduces aggressive behavior, we injected AAV-DIO-NpHr in the LH of orexin-Cre mice and implanted a fiber above the LHb. Optogenetic inhibition of LHb orexin terminals indeed reduced aggression and aggression-CPP in AGGs (Fig. 6i–k) but did not affect aggression in NONs (Extended Data 4). Together, these data indicate that orexin signaling in the LHb modulates aggression as well as its rewarding properties via an OxR2-dependent mechanism.
To assess whether OxR2 signaling in LHb GAD2 neurons is necessary for inter–male aggression, we performed cell-type specific knockdown of OxR2 in GAD2 neurons using a microRNA-based approach (Fig. 7a–b, Extended Data 9). Knockdown of OxR2 in LHb GAD2 neurons reduced aggression and aggression-CPP (Fig. 4m–o), recapitulating the behavioral effects of direct NpHR-mediated inhibition of GAD2 LHb neurons (Fig. 7c–e). Importantly, knockdown of OxR2 in GAD2 neurons did not alter locomotor behavior or time spent in the center of an open field, indicating that effects of this manipulation on aggression were not mediated by changes in overall activity or anxiety (Supplementary Figure 2). Consistent with our previous findings, over-expression of OxR2 in LHb GAD2 neurons did not promote aggressive behavior in NONs (Extended Data 4, 10). These data support the conclusion that OxR2 signaling in LHb GAD2 neurons is involved in regulating the reinforcing properties of aggression, but not its initiation.
Figure 7: Knockdown of OxR2 in GAD2 LHb modulates aggressive behavior in AGGs.
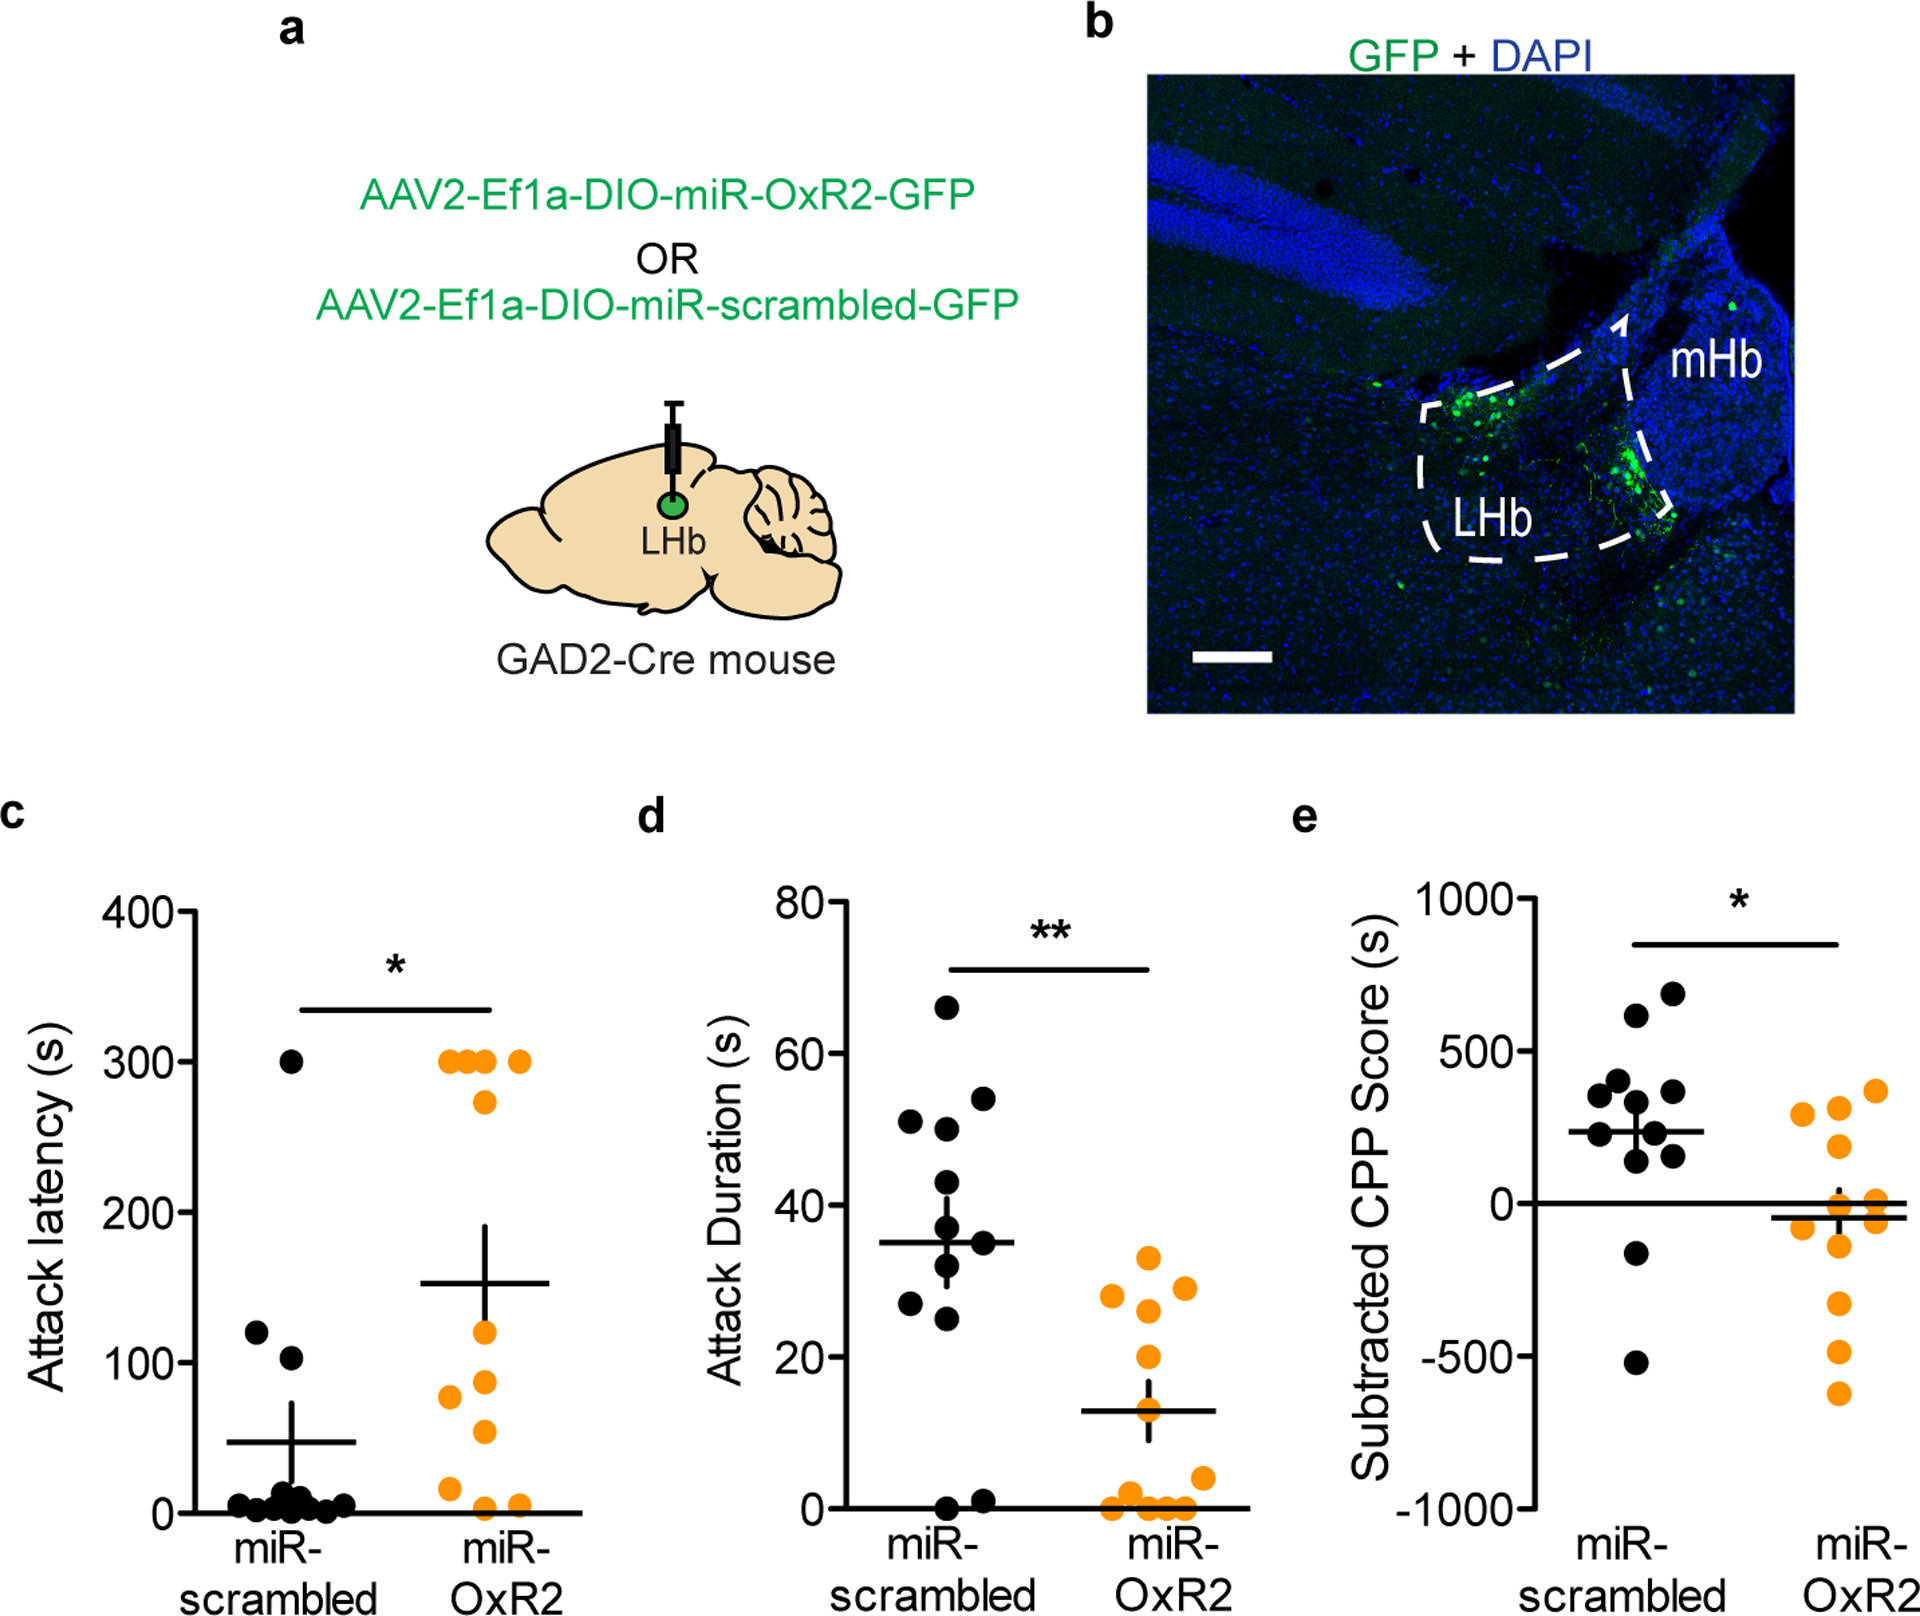
a, Surgical manipulations for GAD2 neuron-specific knockdown of OxR2 in the LHb. b, Representative viral infection for GAD2 neuron-specific knockdown of OxR2 in the LHb, scale bar=300 μm. c, OxR2 knockdown in GAD2 LHb neurons increased attack latency in RI (two-tailed student’s t-test, n=12 biologically independent mice per group, t(22)=2.322, p=0.0299). d, OxR2 knockdown in GAD2 LHb neurons reduced attack duration in RI (two-tailed student’s t-test, n=12 biologically independent mice per group, t(22)=3.183, p=0.0043). e, OxR2 knockdown in GAD2 LHb neurons reduced aggression CPP (two-tailed student’s t-test, n=12 biologically independent mice per group, t(22)=2.155, p=0,0424). * p<0.05, **p<0.01. All data are expressed as mean ± SEM.
Discussion
Our current understanding of the neural circuitry and molecular mechanisms that regulate aggression and that may drive heightened aggression remains incomplete. Here, we used a multidisciplinary approach to monitor, manipulate, and functionally map a previously uncharacterized inhibitory cell type in the LHb that may influence the expression of aggression by altering its rewarding properties. This cell type is under modulatory control by the neuropeptide orexin, which may influence its capacity to promote aggression and preference for aggression-paired contexts.
Our results using in-vivo fiber photometry to measure neural activity provide important new information regarding the dynamics of LHb activity during aggression, and highlight adaptations occurring in LHb neurons as a result of previous fight experience. We demonstrate that attacks are time-locked to reductions in overall LHb activity, which agrees with previous studies showing that functional inhibition of LHb neurons can enhance aggression and its rewarding properties9, 15. Furthermore, we found that as AGGs learn to associate particular contexts with aggressive social interactions involving submissive intruders, the LHb displays reduced activity in these contexts even in the absence of the intruder, suggesting the structure encodes information about the rewarding properties of aggression and aggression-paired contexts based on previous experience. These findings are consistent with recent reports describing plasticity in LHb neurons as animals learn to associate cues predicting aversive or rewarding stimuli28, 29. While activity of the LHb as a whole may be reduced during aggression or in response to aggression-related cues, we have identified a small subset of GAD2-expressing LHb neurons that show robust activation on a similar time scale to the whole LHb. This suggests that multiple LHb cell types, not glutamatergic LHb projection neurons alone, are important for the modulation of aggression and its rewarding properties.
Our study provides the first evidence that GAD2 neurons in the LHb suppress the activity of principal neurons within the LHb that, when active, typically encode aversion. This finding brings into question the currently accepted model of LHb micro-circuit as being purely excitatory by adding a novel element of inhibitory regulation within the LHb. However, many questions about these neurons remain. First, do LHb GAD2 neurons release neuropeptides or other neurotransmitters besides GABA? Notably, we found no evidence of excitatory (glutamatergic) currents in LHb principal neurons elicited by GAD2 neuron stimulation (Fig 4a–b), but this does not preclude the possibility that other messengers are also released from these neurons. In fact, a recent study that performed single-cell sequencing of LHb neurons found that cells expressing GAD2 may also express transcripts encoding precursors for neuropeptides such as pituitary adenylate cyclase-activating polypeptide and enkephalin17. Future studies should aim to verify co-expression of GAD2 and these neuropeptide precursors using in-situ hybridization. Second, LHb GAD2 neurons exert broad inhibitory control over LHb projection neurons in aggression, or is projection-specific connectivity important? Notably, two major outputs of the LHb—the dorsal raphe nucleus (DRN) and ventral tegmental area (VTA)—have been previously implicated in aggressive behavior30, 31, but the role of each of these target regions in controlling motivational aspects of aggression, such as preference for aggression-paired contexts, remains poorly understood. Future investigations should attempt to map the intra- and extra-LHb targets of GAD2 neurons that are important for regulating aggression. Third, what role, if any, do other inputs to LHb GAD2 neurons play in aggression? In addition to expressing OxR2, LHb GAD2 neurons have also been shown to express estrogen and vasopressin receptors18, both of which have been implicated previously in aggression32, 33. It is also possible that other brain areas implicated in aggression regulation and projecting to the LHb, such as the prefrontal cortex34 and the lateral septum35, target LHb GAD2 neurons directly to regulate aggression, and this should also be tested in future studies.
Our results suggest that in the context of appetitive aggression, LHb GAD2 neurons both encode reward-related signals at the completion of attacks and promote future attacks. This is not unlike previous reports that VTA dopamine neurons both encode reward-related signals following the initiation of prosocial interactions and promote future prosocial interactions36. The fact that optogenetic stimulation of LHb GAD2 neurons enhanced aggression in AGGs but did not elicit aggression in NONs suggests that LHb GAD2 neurons are not mediating attack initiation in this context. However, we know from our CPP studies that activity in LHb GAD2 neurons enhances seeking behavior for aggression-associated contexts. Thus, we propose that optogenetic stimulation of LHb GAD2 neurons during RI enhances the perceived reward magnitude of each attack, such that the drive to carry out subsequent attacks is enhanced through repeated positive reinforcement. This may ultimately involve feedback connections between reward centers downstream of the LHb such as the VTA and aggression-initiation centers such as the ventromedial hypothalamus (VMH) and medial amygdala. For example, by providing local inhibition to LHb principal neurons, GAD2 neurons may effectively disinhibit the VTA, thus encoding signals to pre-empt future aggressive behavior. Given how little we know about these GAD2 neurons and their role in behavior, an important question is whether they play a wider role in LHb-mediated behaviors. While we know from our current data that LHb GAD2 neurons promote aggression CPP without altering food CPP or RTPP, it seems unlikely that they broadly promote reward-related behavior. However, future studies will need to test the role of LHb GAD2 neurons in response to additional rewarding stimuli like addictive drugs or pro-social interactinos. We also did not assess the role of LHb GAD2 neurons in other well established LHb-regulated behaviors such as passive, active, or learned aversive behaviors37. Future studies to address the broader behavioral role of these LHb GAD2 neurons is necessary.
As stated above, we provide evidence that LHb GAD2 neurons regulate aggression reward through orexin receptor signaling, which is consistent with studies demonstrating a role for orexin in other motivated behaviors. For example, several groups have shown that inhibition of orexin signaling reduces CPP, self-administration, and relapse for drugs of abuse22, 25, 26, 38–40. In addition, orexin neurons are activated by cues and contexts associated with natural rewards like food41 and sex42. Thus, we were surprised to find that activation of LHb GAD2 neurons did not potentiate – or disrupt – the preference displayed during the testing phase of our palatable food-CPP assay (Fig. S6). While projections from LH glutamate neurons to the LHb indeed impact feeding behaviors43, these may be non-orexinergic glutamate neurons. Instead, LH orexin neurons may primarily influence feeding behavior through projections to regions outside the habenula, including the VTA22. Notably, orexin neurons receive inputs from neurons in the ventromedial hypothalamus (VMH), a region shown to be essential for initiating inter-male attack behavior in mice41, 44. Thus, LH-LHb orexin neurons may form a link between hypothalamic attack centers and circuits controlling motivation. It will be important in future studies to investigate whether orexin neurons projecting to areas other than the LHb are also important for regulating aggression and its rewarding properties, and whether the other known orexin receptor, OxR1, plays any role.
In addition to demonstrating that cell-type specific knockdown of OxR2 reduces aggression and preference for aggression-paired contexts without affecting locomotor behavior, we also found that systemic administration of the OxR2 antagonist EMPA reduces aggression and preference for aggression-paired contexts without affecting locomotor behavior or anxiety-like behavior in the open field test. The lack of an effect of EMPA on locomotion is somewhat surprising, since decades of research have shown that orexin signaling is integral for promoting wakefulness. Indeed, brain-wide deletion deletion of OxR245 results in narcolepsy-like phenotypes in rodents. In addition, the dual orexin receptor antagonist suvorexant is currently an FDA-approved treatment for insomnia, as it aids in the transition from wakefulness to sleep in humans46. While previous studies have shown that 30 mg/kg EMPA (the concentration used in the current study) reduces spontaneous locomotion in rats47, it does not in mice48. Together with our findings, these data suggest that at low doses, EMPA may be able to reduce aggression without side effects on arousal. However, given that spontaneous locomotor activity is not a particularly sensitive assay for arousal, this possibility must be examined in detail in future studies.
It is important to note that these experiments were performed during the light phase. a period of lower activity levels for nocturnal rodents such as mice. While the mechanism is not fully elucidated, aggressive behaviors do show variability across the light-dark cycle49. As the LHb exhibits circadian variations in activity, it is possible that the time of day could impact the extent to which the LHb regulates aggressive behavior50. Future studies should assess whether the phase of the light-dark cycle influences the role of the LHb, and the orexinergic LH-to-LHb GAD2 neuron projection, in the regulation of aggression.
In conclusion, we illustrate here that orexin plays an important role in modulating aggression and preference for aggression-paired contexts through the activation of inhibitory LHb GAD2 neurons. These findings may have implications for the treatment of exaggerated aggression in some patients with psychiatric disorders.
Online Methods
Animals
For experiments in wild-type animals, 4-month old male CD-1 (ICR) mice (sexually experienced retired breeders; Charles River Laboratories) were used as subjects. Subjects were confirmed by CRL to have equal access, experience, and success as breeders. For experiments in transgenic animals, C57BL/6J heterozygous Orexin-cre-IRES-GFP (gift from A. Yamanaka, see20) or homozygous GAD2-Cre (Jackson Laboratory) mice were crossed to wild-type CD-1 mice and the F1 generation was used for experiments. This strategy was necessary to ensure a wide range of aggressive phenotypes in experimental animals, as C57BL/6J mice display relatively low levels of aggressive behavior51. At 3 months of age, F1 transgenic male mice were paired with F1 female mice for two weeks to gain sexual experience before being utilized for experiments. For experiments in transgenic mice, male littermates were randomly assigned to experimental groups. 8–9 week male C57BL/6J mice (20–30g; The Jackson Laboratory) were used as novel intruders. All mice were allowed one week of acclimation to the housing facilities before the start of experiments. Wild-type CD-1 and F1 transgenic mice were singly housed and C57BL/6J mouse were housed in groups of 5. All mice were maintained on a 12 h light:dark cycle (7AM to 7PM) with ad libitum access to food and water. Consistent with many previous studies on aggression31, 49, 52, 53, behavioral experiments were conducted during the light phase. However, it is unclear whether our results are directly comparable to studies performed during the dark phase. Procedures were performed in accordance with the National Institutes of Health Guide for Care and approved by the Use of Laboratory Animals and the Icahn School of Medicine at Mount Sinai Institutional Animal Care and Use Committee. Additional information about mice used in this study can be found in the Life Sciences Reporting Summary.
Aggression screening/Resident Intruder (RI) test
Aggression screening was performed as previously described by utilizing the resident intruder (RI) test9. After a minimum of one week of habituation to home cages, experimental mice were exposed to a novel C57BL/6J intruder for 5 min daily over 3 consecutive days. Each intruder presentation was performed in the home cage of the experimental mouse between 12–3 PM daily under white light conditions. During RI sessions the cage top was removed to allow for unobstructed viewing and video recording of sessions. The duration and number of screening sessions were selected to prevent induction of stress- and anxiety-related behaviors in experimental CD-1 or F1 hybrid mice9. All RI sessions were video recorded with a digital color video camera. Two blind observers recorded (1) the latency to initial aggression and (2) the total duration of aggression. The initiation of aggression was defined by the first clear physical antagonistic interaction initiated by the resident mouse (usually a bite), not including grooming or pursuit behavior. Aggression was considered completed when the resident mouse had reoriented away from the intruder following the initiation of attack. This definition allows for slight breaks (less than 5 s) in continuous physical interaction within an aggressive bout, assuming the resident mouse has remained oriented towards the intruder throughout. Resident mice were defined as AGGs if they initiated aggression during all three screening sessions, while NONs were defined as those that showed no aggression during any screening sessions. Aggression screening was halted if an intruder showed any signs of injury in accordance with our previously published protocols9, 54.
Aggression conditioned place preference (CPP)
We carried out the aggression CPP protocol according to Golden et al.9. Briefly, this task consisted of three phases: pre-test, acquisition (conditioning), and test. Mice were acclimated to the testing facility for 1 h before all testing. All phases were conducted under red light and sound-attenuated conditions. The CPP apparatus (Med Associates) consisted of two unique conditioning chambers with a neutral middle zone that allowed for unbiased entry into either conditioning chamber at the initiation of each trial. During the pre-test phase, mice were placed into the middle chamber of the conditioning apparatus and allowed to freely explore the apparatus for 20 min. There were no group differences in bias for either chamber, and conditioning groups were balanced in an unbiased fashion to account for pre-test preference. The acquisition phase consisted of three consecutive days with two conditioning trials each day for a total of 6 acquisition trials. Morning trials (between 8–10 AM) and afternoon trials (between 3–5 PM) consisted of experimental mice confined to one chamber for 10 min while in the presence or absence of a novel C57BL/6J intruder mouse. All groups were counterbalanced for the conditioning chamber. A total of 3 conditioning trials to the intruder-paired and intruder-unpaired context were performed. On the test day, experimental mice were placed into the middle arena without any intruders and allowed to freely explore the apparatus for 20 min. For optogenetic experiments, light was delivered during the full duration of the test phase only. Total locomotor activity was also recorded to ensure equal exploratory behavior between groups. Behavioral analysis of aggression CPP was performed by calculating (1) CPP score (test phase duration in paired chamber minus test phase duration in unpaired chamber) (2) subtracted CPP score (test phase duration in paired chamber subtracted by pre-test phase duration in paired chamber).
Open field test
The open field test was performed as previously described55. One week after the last RI, experimental mice were acclimated to the testing facility for 1 h before testing. Open-field tests were performed in black plexiglass arenas (42 × 42 × 42 cm; Nationwide Plastics) under red light conditions. Testing sessions lasted for either 5 minutes (GAD2-specific OxR2 knockdown and systemic EMPA experiments) or 10 minutes (non-conditional OxR2 knockdown experiment). Behavior was tracked with Noldus Ethovision (Noldus Interactive Technologies) to record the total distance moved, time spent in the entire arena, and time spent in the delineated “center zone” or “corner zones” of the arena (24 × 24 cm).
Behavioral pharmacology
Mice were injected intraperitoneally with either 30 mg/kg EMPA (Tocris; 4558) dissolved in 0.3% v/v Tween-80 in saline or vehicle (0.3% v/v Tween-80 in saline alone) 25 minutes prior to behavioral testing. For RI tests, animals were given EMPA one day and vehicle the other (counterbalanced for order, within-subjects design). For CPP and open field tests, half of the animals were given EMPA and half were given vehicle (between-subjects design).
Perfusion and brain tissue processing
For immunohistochemistry and histology, mice were given a lethal dose of 15% chloral hydrate and transcardially perfused with cold PBS (pH 7.4) followed by fixation with cold 4% paraformaldehyde (PFA) in PBS. Brains were dissected and post-fixed for 24 h in 4% PFA. Coronal sections were prepared on a vibratome (Leica) at 50 μm to assess viral placement and perform immunohistochemistry.
For in-situ hybridization, mice were rapidly decapitated and brains were removed and flash frozen in −30 degrees C isopentane for 30 s and then stored at −80 degrees C until sectioning. Coronal sections for in-situ were prepared on a cryostat at 16 μm thickness and mounted directly on slides.
For real-time quantitative PCR (RTqPCR), mice were rapidly decapitated and the brains were extracted and placed in ice-cold PBS. Bilateral LHb 1 mm diameter, 1 mm thick, tissue punches were taken and immediately flash frozen on dry ice and stored at −80 degrees until RNA extraction.
RNA extraction, generation of cDNA, and RTqPCR
RNA was isolated from either brain tissue or N2A cells (ATCC, Manassas, VA) using TRIzol (Invitrogen) and chloroform phase separation. The clear RNA layer was processed with the RNAeasy MicroKit (Qiagen), analyzed with the NanoDrop (Thermo Fisher Scientific), and 500 ng of RNA was reverse transcribed to cDNA with qScript (95048–500; Quanta Biosciences). The resulting cDNA was diluted to 1 ng/μl.
For qPCR of hypocretin receptor 1 (Hcrtr1) and hypocretin receptor 2 (Hcrtr2), which encode the OxR1 and OxR2 proteins, 3 μl of cDNA was combined with 5 μl of Perfecta SYBR Green (95054–02K; Quanta Biosciences), forward/reverse primers (1 μl total), and 1 μl of water. Samples were heated to 95 degrees C for 2 min followed by 40 cycles of 95 degrees C for 15s, 60 degrees C for 33 s, and 72 degrees C for 33 s. Analysis was performed using the delta_deltaC(t) method. Samples were normalized to GAPDH. Primers used were as follows: GAPDH (F: AAC GGC ATT GTG GAA GG, R:GGA TGC AGG GAT GAT GTT CT), orexin receptor 1 (OxR1) (F: ATC CAC CCA CTG TTG TT, R: GGC CAG GTA GGT GAC AAT GA), orexin receptor 2 (OxR2) (F: CAT CGT TGT CAT CTG GAT CG, R: GGC ACC AGA GTT TAC GGA AT).
For qPCR of all other transcripts, reactions were performed with 30 ng of cDNA per 10ul reaction, Taqman Fast Advanced Master Mix (Life Technologies), and Taqman probes (Life Technologies) on a QuantStudio 7 Flex Real-Time PCR system (Life Technologies). Taqman probes used were: Avpr2 (Mm01193534_g1), Drd1(Mm02620146_s1), Drd4 (Mm00432893_m1), Glp1r (Mm00445292_m1), Htr3a (Mm00442874_m1), Mchr1 (Mm00653044_m1), and Nmur (Mm00515885_m1). Samples were held at 95 degrees C for 20s, then cycled from 95 degrees C for 1s to 60 degrees C for 20s for 40 cycles. Gene expression was normalized to housekeeping genes Abt1 (Mm00803824_m1) and Hprt (Mm03024075_m1) using the delta_deltaC(t) method.
Generation and validation of AAV2 Cre-dependent OxR2 viral constructs
To create an effective Cre-dependent knockdown virus for OxR2, we utilized a micro-RNA (miR) based approach. The miR was bicistronically expressed with IRES-eGFP for simple identification of infected cells. Briefly, we generated the OxR2 miR using the BLOCK-iT ™ Pol II miR RNAi expression vector kit (Thermo Fisher Scientific). We used the shRNA sequence from our non-conditional OxR2 virus, which was previously validated to inhibit OxR2 expression56. A scrambled sequence was used as the control. We inserted the miR-containing oligonucleotides into a pcDNA6.2-GW-miR vector provided by the kit. The miR sequences, along with the 5’ and 3’ flanking regions, were then sub-cloned into a bicistronic IRES-GFP vector (pAAV-IRES-GFP, Cell Biolabs). This vector was non-conditional and can be expressed in mammalian cells. Suppression of OxR2 with the miR construct was validated in N2A cells (ATCC, Manassas, VA) by qPCR (see above). Once validated in-vitro, the miR-IRES-GFP sequence was inserted into a Cre-dependent AAV2.Ef1a.DIO vector and packaged (Virovek Inc.) to produce AAV2-Ef1a-DIO-miROxR2-IRES-GFP-SV40pA and pAAV-Ef1a-DIO-miRscrambled-IRES-GFP-SV40pA. For over-expression of OxR2, we purchased a non-conditional DNA construct containing OxR2 (pcDNA-CMV-OxR2-Myc-FLAG-hGH-SV40, Genecopoeia) and verified over-expression in N2A cells using qPCR. To create an effective Cre-dependent over-expression virus for OxR2, the sequence for OxR2 was inserted into a Cre-dependent AAV2.Ef1a.DIO vector and packaged to produce AAV2-Ef1a-DIO-OxR2-SV40pA (Virovek,Inc.). These AAVs were subsequently validated in-vivo through injection into GAD2-cre mice and in-situ hybridization for GFP, GAD2, and OxR2.
Immunohistochemistry (IHC), in-situ hybridization (ISH), and confocal microscopy
For IHC experiments, sections were incubated overnight in blocking solution (3% normal donkey serum, 0.3% Triton X-100 in PBS), washed three times in PBS for 10 min (30 min total), then incubated for 24 h in primary antibodies diluted in blocking solution (goat anti-Orexin-A (Santa Cruz Biotechnology, sc-8070; lot: J1818; 1:500 concentration); chicken anti-GFP (Aves Labs, GFP-1020; lot: 879848; 1:1000 concentration). According to manufacturers, goat polyclonal IgG anti-Orexin-A antibody was validated in mouse and human tissue for immunofluorescence. This antibody has been utilized in previous publications to detect orexin-A in mice using immunofluorescence57. According to manufacturers, chicken anti-GFP IgY was validated in transgenic mice expressing GFP using immunofluorescence. This antibody has been used in previous publications to detect GFP in mice using immunofluorescence58. Following primary antibody incubation, sections were then washed three times in PBS for 10 min (30 min total), incubated for 2 h in secondary antibodies diluted in blocking solution (donkey anti-goat Cy3 1:400 (Jackson ImmunoResearch; 705-165-003); donkey anti-chicken AlexaFluor 488 1:400 (Jackson ImmunoResearch; 703-545-155), and washed three times in PBS for 10 min (30 min total). Finally, sections were counterstained with 1 ug/ml DAPI (Sigma) for 10 min and mounted on slides. Sections were allowed to dry on slides overnight, dehydrated with ethanol and then Citrisolv, and cover-slipped with ProLong Diamond Antifade Mountant (Invitrogen; P36970). IHC of orexin axons and GAD2 LHb cells were imaged using the AiryScan method on a LSM 880 confocal microscope (Carl Zeiss) and analyzed with Imaris (Bitplane). All other IHC was imaged with a LSM 780 confocal microscope (Carl Zeiss) and analyzed with FIJI 1.0 (ImageJ) software.
For ISH experiments, we utilized the RNAScope Multiplex Fluorescent in-situ kit (Advanced Cell Diagnostics) according to the manufacturer’s instructions. Briefly, fresh frozen sections were fixed in ice-cold 4% PFA in PBS for 15 minutes, serially dehydrated with EtOH (50%, 75%, 100%; each for 2 minutes), and pretreated with a protease (Protease IV, RNAScope) for 30 min. RNAscope probes (Advanced Cell Diagnostics) for eGFP (cat. 400281), glutamic acid decarboxylase 2 (GAD2, cat. 415071), vesicular glutamate transporter 2 (vGlut2, cat. 319171), or orexin receptor 2 (OxR2, cat. 460881) were hybridized at 40 degrees C for 2 h, serially amplified, counterstained with 1 ug/ml DAPI for 2 min, and immediately cover-slipped with EcoMount mountant (Biocare Medical). In-situ hybridization was imaged with a Zeiss LSM 780 confocal microscope at 20x, 40x, or 63x magnification. mRNA puncta were quantified manually, blinded to experimental condition, using FIJI 1.0 software (Image J). Additional information about antimodies and in-situ hybridization reagents can be found in the Life Sciences Reporting Summary.
In-vitro electrophysiology
Slice preparation
Adult male mice were anesthetized with isoflurane, decapitated, and the brain was immediately removed and submerged into ice-cold sucrose-artificial CSF (aCSF) comprising (in mM) 233.7 sucrose, 26 NaHCO3, 3 KCl, 8 MgCl2, 0.5 CaCl2, 20 glucose, and 0.4 ascorbic acid. Coronal sections (350 microns thick) were sliced using a Leica VT1000S vibratome and allowed to equilibrate in recording aCSF (in mM: 117 NaCl, 4.7 KCl, 1.2 MgSO4, 2.5 CaCl2, 1.2 NaH2PO4, 24.9 NaHCO3, and 11.5 glucose) oxygenated with 95% O2-5% CO2 for 1 hour at RT. Slices were then transferred to the recording chamber where they were maintained at 31 degC and perfused (1.5 ml/min) with oxygenated aCSF.
Orexin bath application recordings
2 weeks prior to recording, GAD2-cre were injected in the lateral habenula (see coordinates in following section) with AAV-hSyn-DIO-eYFP (UPenn Viral Core). Mice were then returned to their home cage to allow for viral expression before being killed for slice recordings. During recording, cells were identified as GAD2-positive by expression of eYFP in the lateral habenula. Neurons were visualized on an upright epifluorescence microscope (BX50WI; Olympus) with a 40X water-immersion objective and an infrared CCD monochrome video camera (Dage-MTI). Whole-cell recordings were performed with glass micropipettes (resistance 2–4 MΩ) pulled from borosilicate glass capillaries using a P-87 micropipette puller (Sutter Instruments). The pipettes were filled with an intracellular solution containing: 124 mm K-gluconate, 10 mm HEPES, 10 mm phosphocreatine di(Tris), 0.2 mm EGTA, 4 mm Mg2ATP, and 0.3 mm Na2GTP, adjusted to an osmolarity of 280–290 mOsm and pH of 7.3. Recordings were made with a Multiclamp 700B (Molecular Devices) in current-clamp mode. Analog signals were low-pass filtered at 2 kHz and digitized at 5kHz using a Digidata 1440A interface and pClamp 10.0 software (Molecular Devices). Gigaseal and access to the intracellular neuronal compartment was achieved in voltage-clamp mode, with the holding potential set at −70 mV. After rupturing the membrane, intracellular neuronal fluid equilibrated with the pipette solution without significant changes in series resistance or membrane capacitance. Cells were allowed to normalize for 5 minutes before recording. To test response of cells to orexin A (Phoenix Pharmaceuticals), we applied orexin A (1 μM) for 5 minutes in the circulating bath after a 2-minute baseline period, followed by washout for 45–60 minutes. Orexin A was prepared freshly and dissolved in aCSF before being added to recording bath.
Offline analysis was performed using Clampfit 10.0 (Molecular Devices). Spikes were counted during baseline, orexin wash-in, and wash-out periods. To account for bath circulation, spikes were counted 2 minutes after drug was added or after wash-out began. Kruskal-Wallis test with Dunn’s post-hoc tests for multiple comparisons was conducted to analyze mean firing rate between groups (baseline, orexin wash-in, and wash-out) using GraphPad Software Prism (version 5).
Slice optogenetic stimulation of LHb GAD2 neurons recording
2 weeks prior to recording, GAD2-Cre mice were injected with AAV1-DIO-ChR2-eYFP (UPenn Viral Core) in the LHb. Mice were then returned to their home cage to allow for viral expression before being killed for slice recordings. Recordings were obtained with borosilicate glass electrodes (5–8 MΩ resistance) filled with voltage clamp internal solution (in mM: 120 Cs-methanesulfonate, 10 HEPES, 10 Na-phosphocreatine, 8 NaCl, 5 TEA-Cl, 4 Mg-ATP, 1 QX-314, 0.5 EGTA, and 0.4 Na-GTP). Cells were visualized on an upright DIC microscope equipped with a 460 nm objective-coupled LED (Prizmatix) for verification of ChR2 expression as well as optogenetic cellular manipulations. Data were low-pass filtered at 3 kHz and acquired at 10 kHz using Multiclamp 700B and pClamp 10.0 (Molecular Devices). The polarity of light-evoked stimulation (λ 460, 1 mW, 1–5 ms) of ChR2+ terminals was determined by clamping cells at −70mV (excitatory responses) and 0mV (inhibitory responses). The monosynaptic nature of light-evoked currents was confirmed by bath application of tetrodotoxin (1 μM; Abcam) and 4-aminopyridine (100 μM; Abcam) as previously described59, 60. The location of cells within the LHb was confirmed visually after recording.
Stereotaxic surgery and viral gene transfer
Mice were anesthetized with a mixture of ketamine (100 mg/kg body weight) and xylazine (10 mg/kg body weight) and placed securely in a stereotaxic frame (David Kopf Instruments). 33-gauge syringes (Hamilton Co.) were used to bilaterally infuse 0.5 μl of virus over 5 min and virus was allowed to diffuse for 5 minutes before the needle was withdrawn. For lateral hypothalamus (LH) injections, the coordinates from bregma were −1.3 mm AP, +/− 1.1 mm ML, and −5.1 mm DV at a 0-degree angle. For lateral habenula (LHb) injections, the coordinates from bregma were −1.7 mm AP, +/− 0.6 mm ML, and −2.7 mm DV at a 10-degree angle. For all optogenetics experiments animals were implanted with an optical fiber at the same time as viral injection (−2.3 mm DV). Optic fibers (Doric Lenses, MFC_200/240–0.22_2.6mm_FLT) were secured to the skull using C&B Metabond adhesive luting cement (Parkell Dental Supply). For electrophysiology experiments, GAD2-cre F1 mice were injected bilaterally in the LHb with either AAV1-hSyn-DIO-eYFP or AAV1-hSyn-DIO-ChR2.eYFP (UPenn Viral Core). For orexin optogenetics experiments, AAV1-hSyn-DIO-NpHr3.0-eYFP, AAV1-hSyn-DIO-ChR2-eYFP, or AAV1-hSyn-DIO-eYFP (UPenn Viral Core) was injected into the LH of Orexin-cre-IRES-GFP F1 mice and the optic fiber was placed in the LHb. Importantly, IRES-GFP labeling of orexin neurons is not visible without enhancement of GFP signal using immunohistochemistry, while viral eYFP is visible in perfused slices without amplification. This is evident in images of LH tissue from orexin-cre animals injected with AAV-DIO-eYFP—only a portion of the total orexin neurons are green due to infection with the virus. The specificity of viral expression in orexin positive neurons was confirmed (Fig. 5d, S5). For GAD2 neuron optogenetics experiments, GAD2-cre F1 mice were injected bilaterally in the LHb with either AAV1-hSyn.DIO-NpHr3.0-eYFP, AAV1-hSyn-DIO-ChR2-eYFP, or AAV1-hSyn-DIO-eYFP (UPenn Viral Core). For conditional knockdown of OxR2, GAD2-cre F1 mice were injected bilaterally in the LHb with either AAV2-Ef1a-DIO-miROxR2-IRES-eGFP (knockdown) or AAV2-Ef1a-DIO-eGFP (Virovek, Inc, generated for this paper). For conditional over-expression of OxR2 GAD2-Cre F1 mice were injected bilaterally in the LHb with either AAV2-EF1a-DIO-GFP or AAV2-EF1a-DIO-OxR2. For non-conditional knockdown of OxR2 during optical stimulation of orexin terminals in the LHb, orexin-Cre F1 mice were injected with AAV1-hSyn-DIO-ChR2 or AAV1-hSyn-DIO-eYFP in the LH and AAV2-hSyn-Cre plus AAV2-Ef1a-DIO-miR-OxR2-GFP or AAV2-Ef1a-DIO-miR-scrambled-GFP in the LHb. For fiber photometry in all LHb neurons, wild-type CD1 mice were injected unilaterally in the LHb with AAV1-hSyn-GCaMP6s. For fiber photometry in GAD2 neurons, GAD2-Cre mice were injected unilaterally in the LHb with AAV9-hSyn-FLEX-GCaMP6s. Optic fibers for photometry (Doric Lenses, MFC_400/430–0.48_2.7mm_MF2.5-FLT) were implanted over the LHb at the same time as viral injection and secured with dental cement. AAV1 and AAV9 viruses were allowed 2–4 weeks for expression, while AAV2 viruses were allowed 4–6 weeks for expression.
Optogenetic stimulation
For blue light stimulation (ChR2), optical fibers (Doric Lenses, MFC_200/240–0.22_2.6mm_FLT) were connected to a 473-nm blue laser diode (Crystal Laser, BCL-473–050-M) using a patch cord with an FC/PC adapter (Doric Lenses, MFP_200/240/900–0.22_4m_FC-MF2.5). A function generator (Agilent Technologies; 33220A) was used to generate 20 ms blue light pulses at 20 Hz. The intensity of light delivered to the brain was 7–10 mW. These parameters are consistent with previously validated and published protocols9. In particular, 20 Hz was selected for excitation of orexin neurons since in-vitro experiments have demonstrated that 20 Hz stimulation is sufficient to elicit activation of orexin receptors61.
For yellow light stimulation (NpHR), optical fibers were connected to a 561-nm yellow laser diode (Crystal Laser, CL561–050L) using an FC/PC adapter. A function generator (Agilent Technologies; 33220A) was used to generate constant light pulses for 8 s followed by 2 s of light off. The intensity of the light delivered to the brain was 7–10 mW. These parameters are consistent with previously validated and published protocols9.
For all optogenetics experiments, experimental mice were habituated to patch cords for 5 days prior to testing in RI and aggression CPP. For RI experiments, mice were tested twice in the same day (in a counterbalanced fashion) in both laser on and laser off conditions with at least 4 hours between sessions (within subjects design). For CPP experiments, both groups (YFP or opsin) received laser stimulation (between subjects design).
Real-time place preference
For real-time place-preference (RT-PP) experiments, mice were placed in the center of an open field and allowed to freely explore for 20 minutes. The time spent on each side was recorded. For the first 10 minutes of testing, one side of the open field was paired with 20 ms pulses of 20 Hz blue light stimulation (473 nm, 7–10 mW intensity). For the second 10 minutes of testing, laser stimulation was paired with the opposite side of the open field. This was done to minimize inherent bias towards one side of the open field. A RT-PP score was calculated by subtracting the total time spent in the unstimulated side from the total time spent in the stimulated side.
Palatable food CPP
The palatable food CPP task consisted of three phases: pre-test, acquisition (conditioning), and test. Mice were acclimated to the testing facility for 1 h before all testing. All phases were conducted under red light conditions. The CPP apparatus (Med Associates) consisted of two unique conditioning chambers with a neutral middle zone that allowed for unbiased entry into either conditioning chamber at the initiation of each trial. During the pre-test phase, mice were placed into the middle chamber of the conditioning apparatus and allowed to freely explore the apparatus for 20 min. There were no group differences in bias for either chamber, and conditioning groups were balanced in an unbiased fashion to account for pre-test preference. The acquisition phase consisted of six consecutive days with two conditioning trials each day for a total of 12 acquisition trials. Morning trials (between 8–10 AM) and afternoon trials (between 3–5 PM) consisted of experimental mice confined to one chamber containing Reese’s mini peanut butter cups for 20 min and one chamber containing standard chow for 20 min. Mice were exposed to Reese’s mini peanut butter cups in the home cage prior to CPP testing to reduce effects of novelty during conditioning. All groups were counterbalanced for the conditioning chamber and conditioning time (AM vs. PM pairings with peanut butter cups). On the test day, experimental mice were placed into the middle arena and allowed to freely explore the empty apparatus for 20 min. For optogenetic experiments, light was delivered during the full duration of the test phase only and not during conditioning. Behavioral analysis of CPP was performed by calculating (1) CPP score (test phase duration in paired chamber minus test phase duration in unpaired chamber) (2) subtracted CPP score (test phase duration in paired chamber subtracted by pre-test phase duration in paired chamber).
Fiber photometry
Apparatus: Resident Intruder and Aggression CPP
A fiber optic patch cord (Doric Lenses, MFP_400/430/1100–0.37_3m_FC-MF2.5) was attached to the implanted fiber optic cannula with cubic zirconia sleeves. In turn, the fiber optic cable was coupled to the apparatus for light delivery and signal measurement. GCaMP6s signal was measured by passing 490 nm LED light (Thorlabs) through a GFP excitation filter (MF469; Thorlabs) and dichroic mirrors (DMLP425, MD498; Thorlabs) into the brain and focusing emitted light onto a photodetector (2151 femtowatt receiver; Newport) after passing it back through a dichroic mirror (MD498; Thorlabs), through a GFP emission filter (MF525–39; Thorlabs), and through a 0.50 N.A. microscope lens (62–561;Edmund Optics). To account for auto-fluorescence and possible motion artifacts during testing, a second 405 nm LED not corresponding to GCaMP6s delivered light through a violet excitation filter (FB405–10; Thorlabs) and the same dichroic mirrors as the 490 nm light. This signal was similarly directed into the brain and subsequently measured with the photodetector. Light at the fiber tip ranged from 30 to 75 μW but was constant across trials over days. Simultaneous recording of both 490 and 405 nm channels was achieved through sinusoidal modulation of the LEDs at different frequencies so that the signals could be easily unmixed. Signals were collected at a rate of 381 Hz and visualized using a real-time signal processor (RX8; Tucker-Davis Technologies) and PC OpenEx 2.20 software (Tucker-Davis Technologies).
Behavior: Resident Intruder and Aggression CPP
The timeline for aggression photometry experiments was as follows: viral injection and ferrule implantation (day 0), habituation to patch cord (days 14–15), RI recordings (days 16–18), and CPP recordings (days 21–25). Once hooked up to the apparatus, mice were allowed to rest for 10 minutes before the start of recording. Once recording was initiated, the GCaMP signal was allowed to stabilize for two minutes before the start of the behavioral trial. On each day of RI, we collected 5 minutes of baseline recordings followed by 5 minutes of intruder exposure. For CPP, photometry data was collected during the entire 20-minute pre-test and test.
Analysis: Resident Intruder and Aggression CPP
Analysis of signals was done using custom written MATLAB 8.5 code36, 62, which can be obtained from the authors upon request. The bulk fluorescent signal from each channel was normalized to compare across recording sessions and animals. Change in fluorescence was calculated as a percentage of the total fluorescence signal in the GCaMP channel (deltaF/F). The 405 channel served as the control channel and was subtracted from the GCaMP channel to eliminate signals due to auto-fluorescence, bleaching, and the bending of the fiber optic cord during aggression. In general, these motion artifacts had very minimal effects on the overall GCaMP signal. Behavioral data was temporally aligned with fluorescence recording data by sending 1s-interval TTL signals to the OpenEx software from Noldus Ethovision (Noldus Interactive Technologies) behavioral recording software. To identify peak signals, we first determined the median average deviation (MAD) of the corrected/normalized data sets. Peak events that exceeded the MAD by 2.91 deviations were determined to be significant peaks, and this is in accordance with previous reports using the fiber photometry technique36, 62. For analysis of LHb GCaMP activity during discrete behaviors in RI, average deltaF/F signals (%) in the two seconds before and after a discrete event (bite, approach, withdrawal) were compared. A bite was determined to occur at the moment of jaw closing on the body of the intruder, an approach at the moment of resident nose contact with any body part of the intruder, and a withdrawal at the moment body contact between resident and intruder ceased and one or both mice turned away from the site of interaction.
Apparatus: Palatable food consumption
A branched fiber optic patch cord (Doric Lenses, BFP_200/230/900–0.37_FC-MF1.25) connected to the fiber photometry apparatus (Neurophotometrics, Ltd.) was attached to the implanted fiber optic cannula using a cubic zirconia sleeve. To record fluorescence signals from GCaMP6s, light from a 470 nm LED was bandpass filtered, collimated, reflected by a dichroic mirror, and focused by a 20x objective. LED light was delivered at a power that resulted in 75–150 uW of 470 nm light at the tip of the patch cord. Emitted GCaMP6s fluorescence was bandpass filtered and focused on the sensor of a CCD camera. To account for auto-fluorescence and possible motion artifacts during testing, a second 560 nm LED not corresponding to GCaMP6s delivered light through a excitation filter and the same dichroic mirrors as the 470 nm light. This signal was similarly directed into the brain and subsequently measured with the CCD camera. Simultaneous recording of both 470 and 560 nm channels was achieved through an integrated camera and image splitter (Flir Blackfly S series). Signals were collected at a rate of 40 Hz and visualized using the open-source software Bonsai 2.4 (http://bonsai-rx.org).
Behavior: Palatable food consumption
All recordings were performed in the subjects’ home cages between 10AM-12PM. The timeline for photometry experiments was as follows: viral injection and ferrule implantation (day 0), habituation to patch cord (days 14–15), then recordings with food interactions (days 21–30). For food-restricted conditions, food was removed from cages at 5PM the day before testing for a total food-restriction period of 18 hours. Once attached to the patch cord, animals habituated for a period of 10 minutes while video and LED protocols were started. Baseline signal was taken from the final 5 minutes of recording before a 5-minute exposure to food. Behaviors were scored manually using JWatcher 1.0 (Daniel T Blumenstein, Janice C Daniel, and Christopher S Evans, http://www.jwatcher.ucla.edu/)).
Analysis: Palatable food consumption
For fiber photometry analysis, the bulk fluorescent signal from each channel was normalized to compare across recording sessions and animals. Change in fluorescence was calculated as a percentage of the total fluorescence signal in the GCaMP channel (deltaF/F). The 560 nm channel was used to control for auto-fluorescence, bleaching, and the bending of the fiber optic cord during testing. In general, these motion artifacts had very minimal effects on the overall GCaMP signal. For analysis of LHb GCaMP activity during food consumption, average deltaF/F signals in the ten seconds before and after consumption were compared.
Statistics
All statistical details can be found in the figure legends, including type of statistical analysis used, p values, n, what n represents, degrees of freedom, and t or F values. No statistical methods were used to pre-determine sample sizes but out sample sizes are similar to those reported in previous publications8, 9, 44, 63. Animals and samples were assigned randomly to control and experimental groups, except for cases where aggressive behavior was compared between groups. In these cases, aggression was assessed and groups were counter-balanced for equal levels of aggression before manipulations were performed. While experimenters were not blind to group allocation for data collection, subsequent analysis of behavioral videos during the RI test were performed blind to experimental conditions. Experimenters were blind to experimental conditions for analysis of in-situ hybridization. Data points were excluded if they were statistically significant outliers according to Grubb’s test for outliers. This test was only performed once per data set. In experiments requiring viral infection of a specific brain region, mice were excluded from behavioral analysis if the virus was found to be mis-targeted or not expressed according to pre-determined anatomical criteria. No data was excluded for other reasons. For comparisons of two experimental groups, two-tailed paired (student’s, within subject) or unpaired (between subject) t-tests were used. For parametric data sets, comparisons of three or more groups were performed using one or two-way ANOVA tests followed by a Bonferroni posthoc test. For non-parametric data sets, comparisons of three or more groups were performed using Kruskall-Wallis one-way ANOVA followed by Dunn’s test for multiple comparisons. It was assessed whether groups displayed equal or unequal variances prior to using either parametric or non-parametric statistical tests. For all tests, p<0.05 was deemed significant. Statistical analyses were performed using Graph Pad Prism 5 software. Additional information about study design and statistics can be found in the Life Sciences Reporting Summary.
Code availability
Matlab code used to analyze photometry data is available from the corresponding author upon request.
Data availability
The data that support these findings are available from the corresponding author upon request.
Extended Data
Extended Data Fig. 1. LHb non-conditional fiber photometry supporting data.
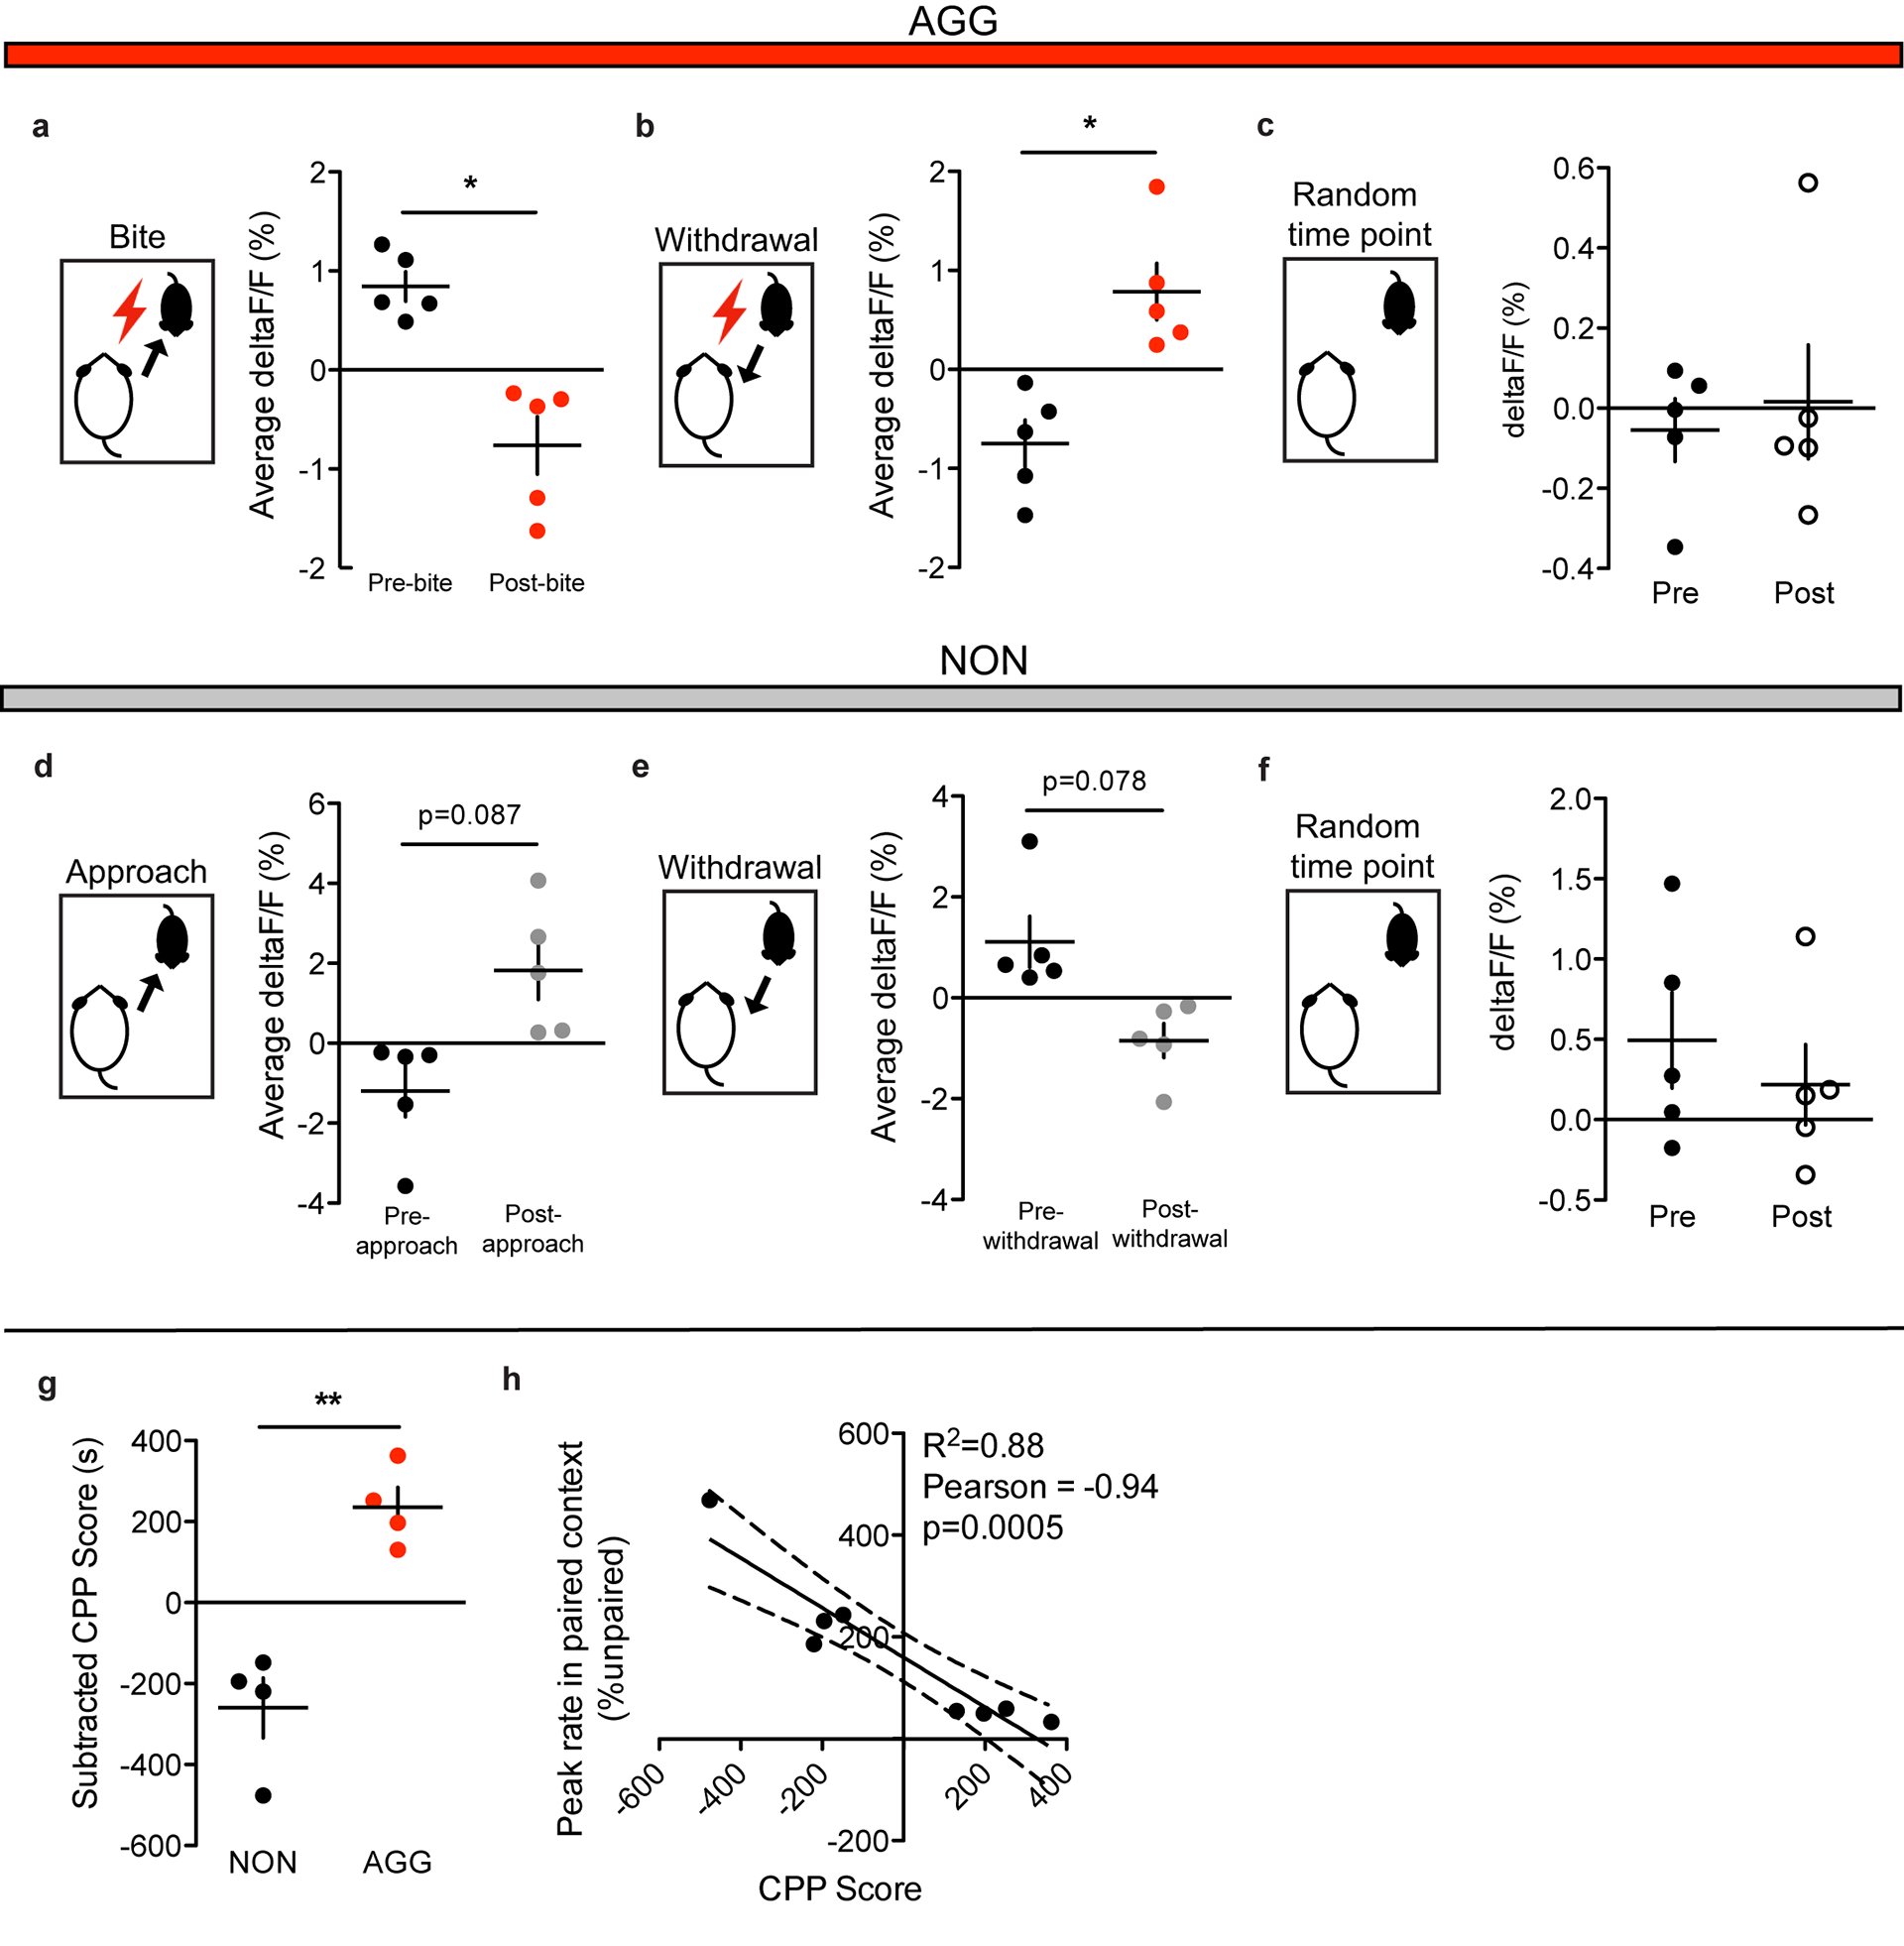
a, AGG average LHb activity was reduced following a bite on day 1 of RI (two-tailed paired t-test, n=5 biologically independent mice, 3–5 bites per mouse, t(4)=3.763, p=0.0197). b, AGG average LHb activity was increased following a withdrawal from aggression on day 1 of RI (two-tained paired t-test, n=5 biologically mice, 3–5 withdrawals per mouse, t(4)=3.229, p = 0.03). c, AGG average LHb activity did not differ before and after random time points during RI on day 3 (two-tailed paired t-test, n=5 biologically independent mice, t(4)=0.6545, p = 0.5485). d, NON average LHb activity was not significantly increased following intruder approach on day 1 of RI (two-tailed paired t-test, n=5 biologically independent mice, 3–5 approaches per mouse, t(4)=2.25, p = 0.087). e, NON average LHb activity was not significantly reduced following withdrawal from social interactions on day 1 of RI (two-tailed paired t-test, n=5 biologically independent mice, 3–5 withdrawals per mouse, t(4)=2.353, p = 0.078). f, NON average LHb activity did not differ before and after random time points during RI on day 3 (two-tailed paired t-test, n=5 biologically independent mice, 5 time points per mouse, t(4)=0.553, p = 0.6221). g, AGGs used for fiber photometry experiments displayed significantly higher aggression CPP scores than NONs (two-tailed student’s t-test, n=4 biologically independent mice per group, t(6)=5.591, p = 0.0014). h, LHb peaks in the intruder paired context during the CPP preference test were negatively correlated with CPP score (two-tailed student’s t-test, n=8 biologically independent mice, Pearson correlation coefficient = −0.94, R2 = 0.88, p = 0.0005). *p<0.05, **p<0.01. All data are expressed as mean ± SEM.
Extended Data Fig. 2. LHB GAD2 neuron fiber phohometry supporting data.
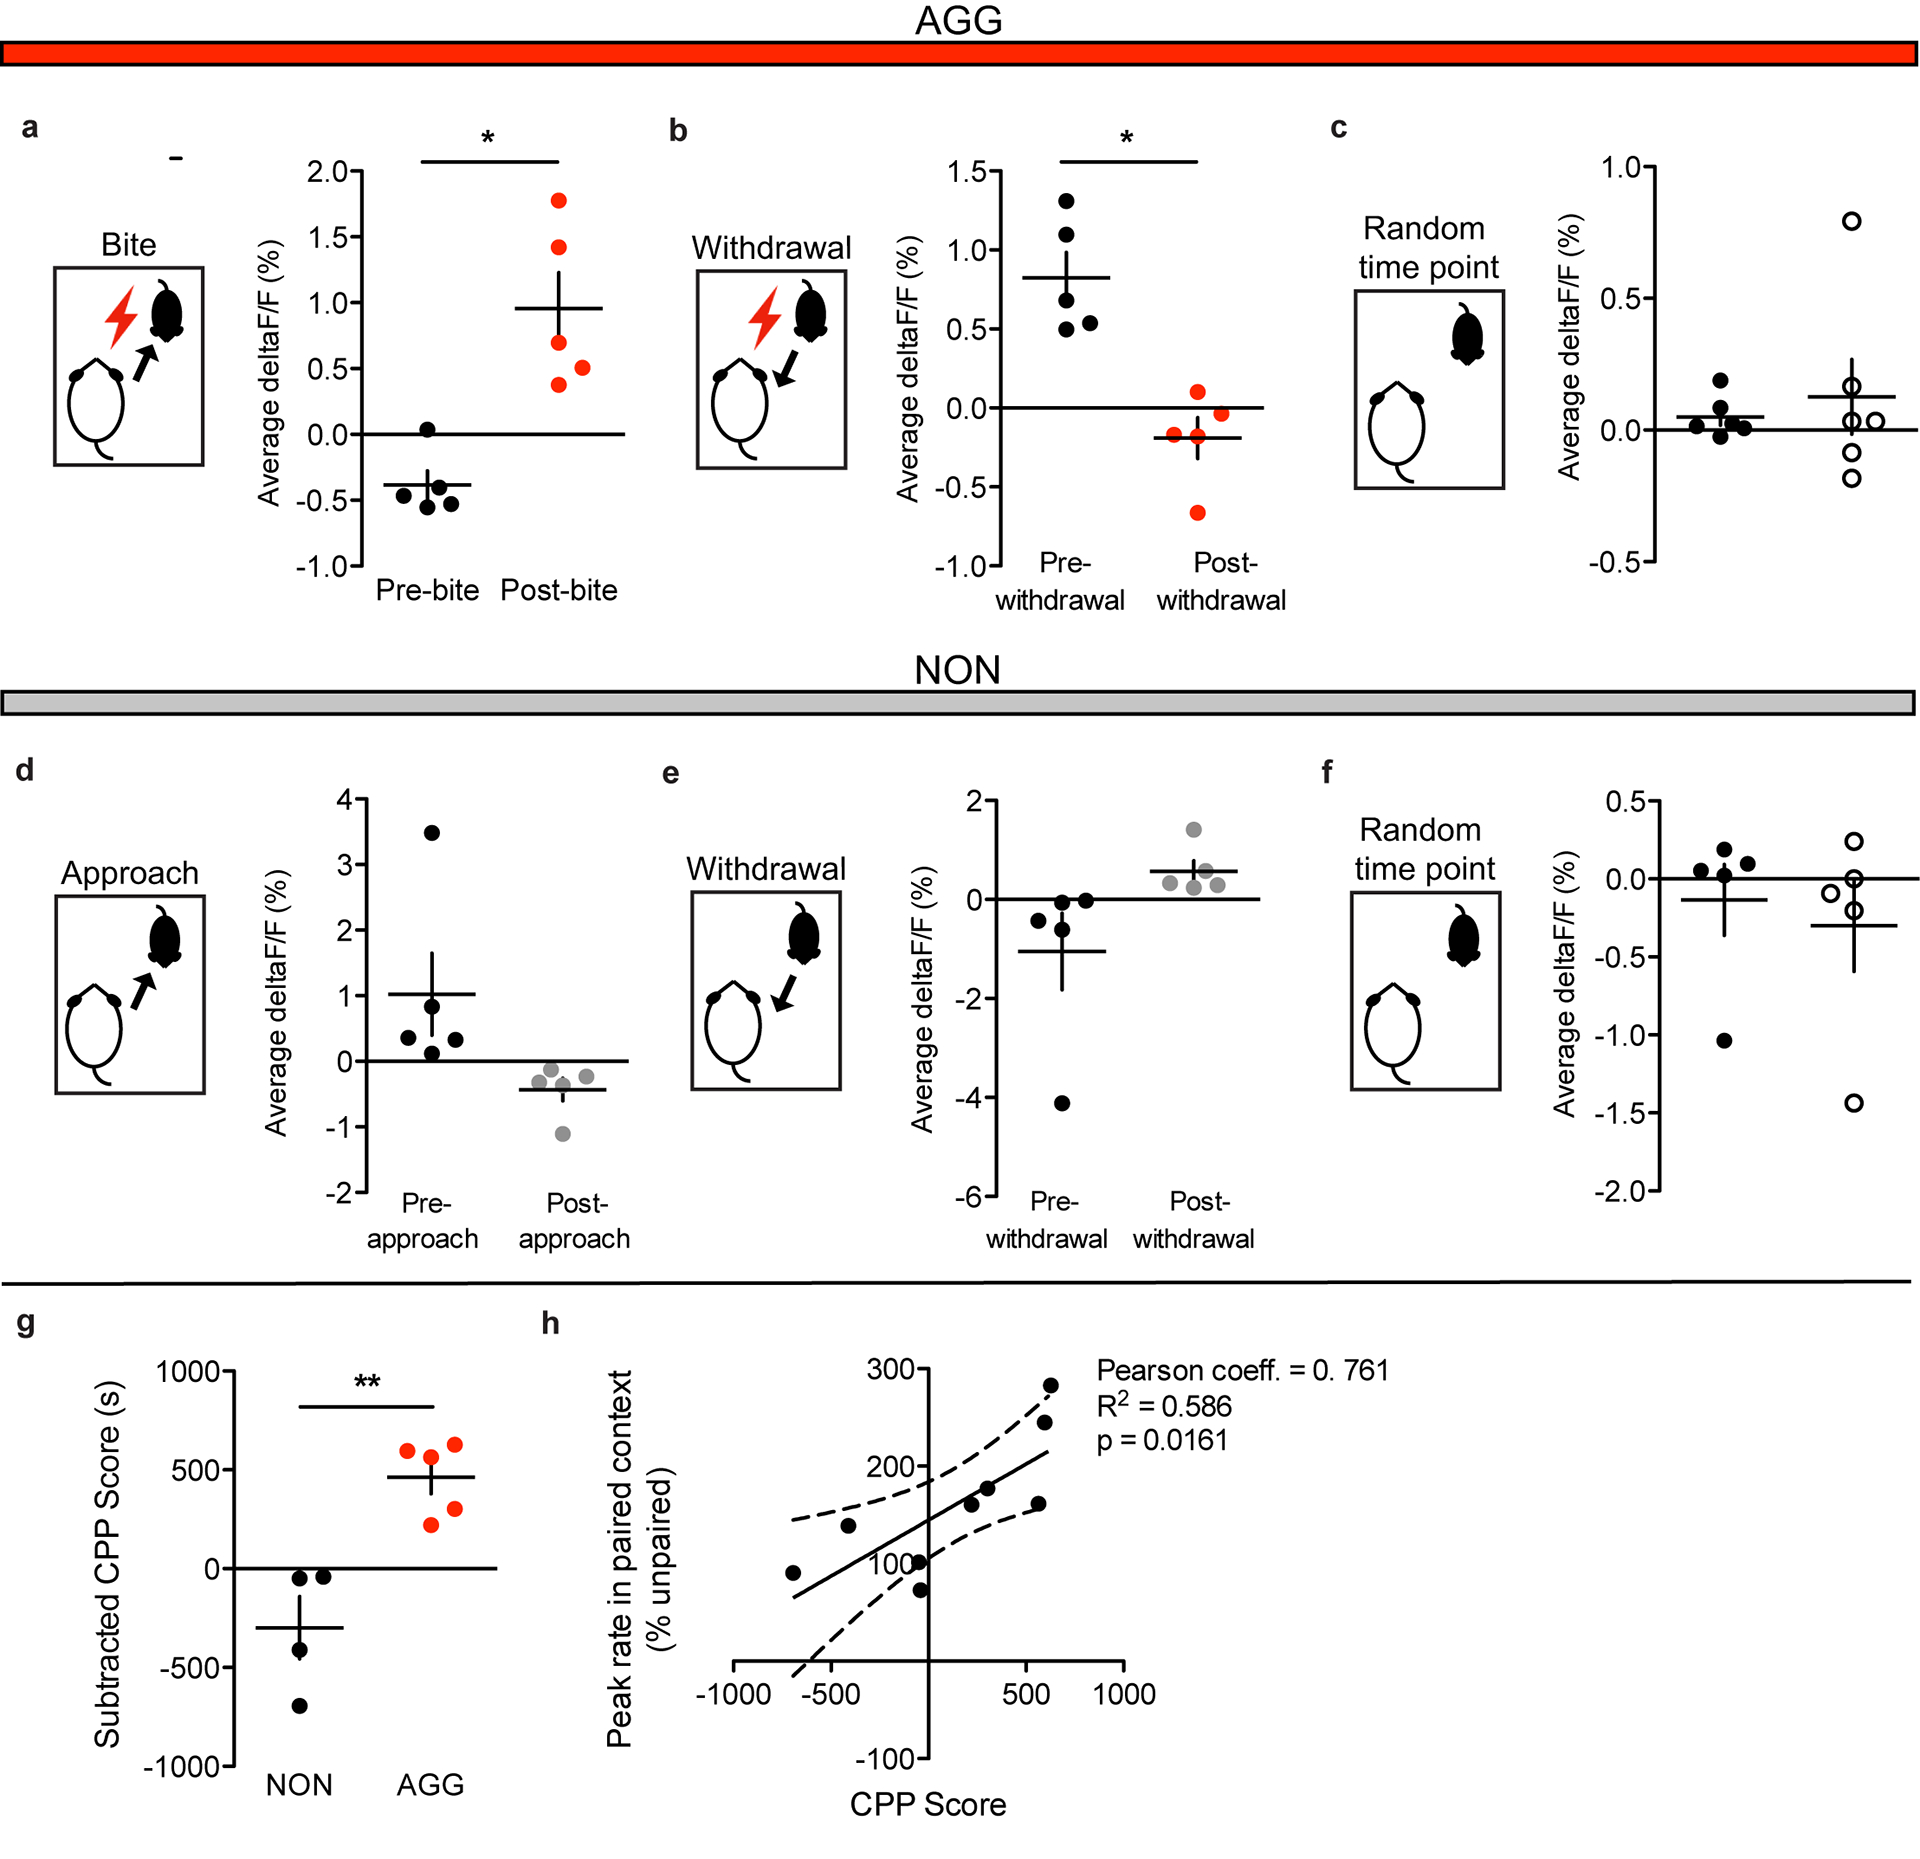
a, AGG LHb GAD2 neuron activity was increased following bites on day 1 of RI (two-tailed paired t-test, n=5 biologically independent mice, 2–5 bites per mouse, t(4)=4.008, p=0.016). b, AGG LHb GAD2 neuron activity was reduced following a withdrawal from an aggressive encounter on day 1 of RI (two-tailed paired t-test, n=5 biologically independent mice, 3–5 withdrawals per mouse, t(4)=3.982, p=0.0164). c, AGG LHb GAD2 neuron activity did not differ before and after random times points on day 3 of RI (two-tailed paired t-test, n=5 biologically independent mice, 5 time points per mouse, t(4)=0.493, p=0.6475). d, NON LHb GAD2 neuron activity was not different before and after an approach on day 1 of RI (two-tailed paired t-test, n=5 biologically independent mice, 3–5 approaches per mouse, t(4)=1.843, p=0.1406). e, NON LHb GAD2 neuron activity was not different before and after a withdrawal from a non-aggressive social interaction on day 1 of RI (two-tailed paired t-test, n=5 biologically independent mice, 3–5 withdrawals per mouse, t(4)-1.633, p=0.1777). f, NON LHb GAD2 neuron activity did not differ before and after random time points on day 3 of RI (two-tailed paired t-test, n=5 biologically independent mice, t(4)=1.721, p=0.1634). g, GAD2-cre AGGs used for fiber photometry experiments displayed significantly higher aggression CPP scores than GAD2-cre NONs (two-tailed paired t-test, n=5 biologically independent mice, t(4)=2.885, p=0.0448). h, LHb GAD2 neurons peaks in the intruder paired context during the CPP preference test were positively correlated with CPP score (two-tailed student’s t-test,A n=10 biologically independent mice, Pearson correlation coefficient = 0.761m, R2=0.586, p=0.0161). *p<0.05, **p<0.01. *p<0.05. All data are expressed as mean ± SEM.
Extended Data Fig. 3. Anterograde tracing of LHB GAD2 neuron projections.
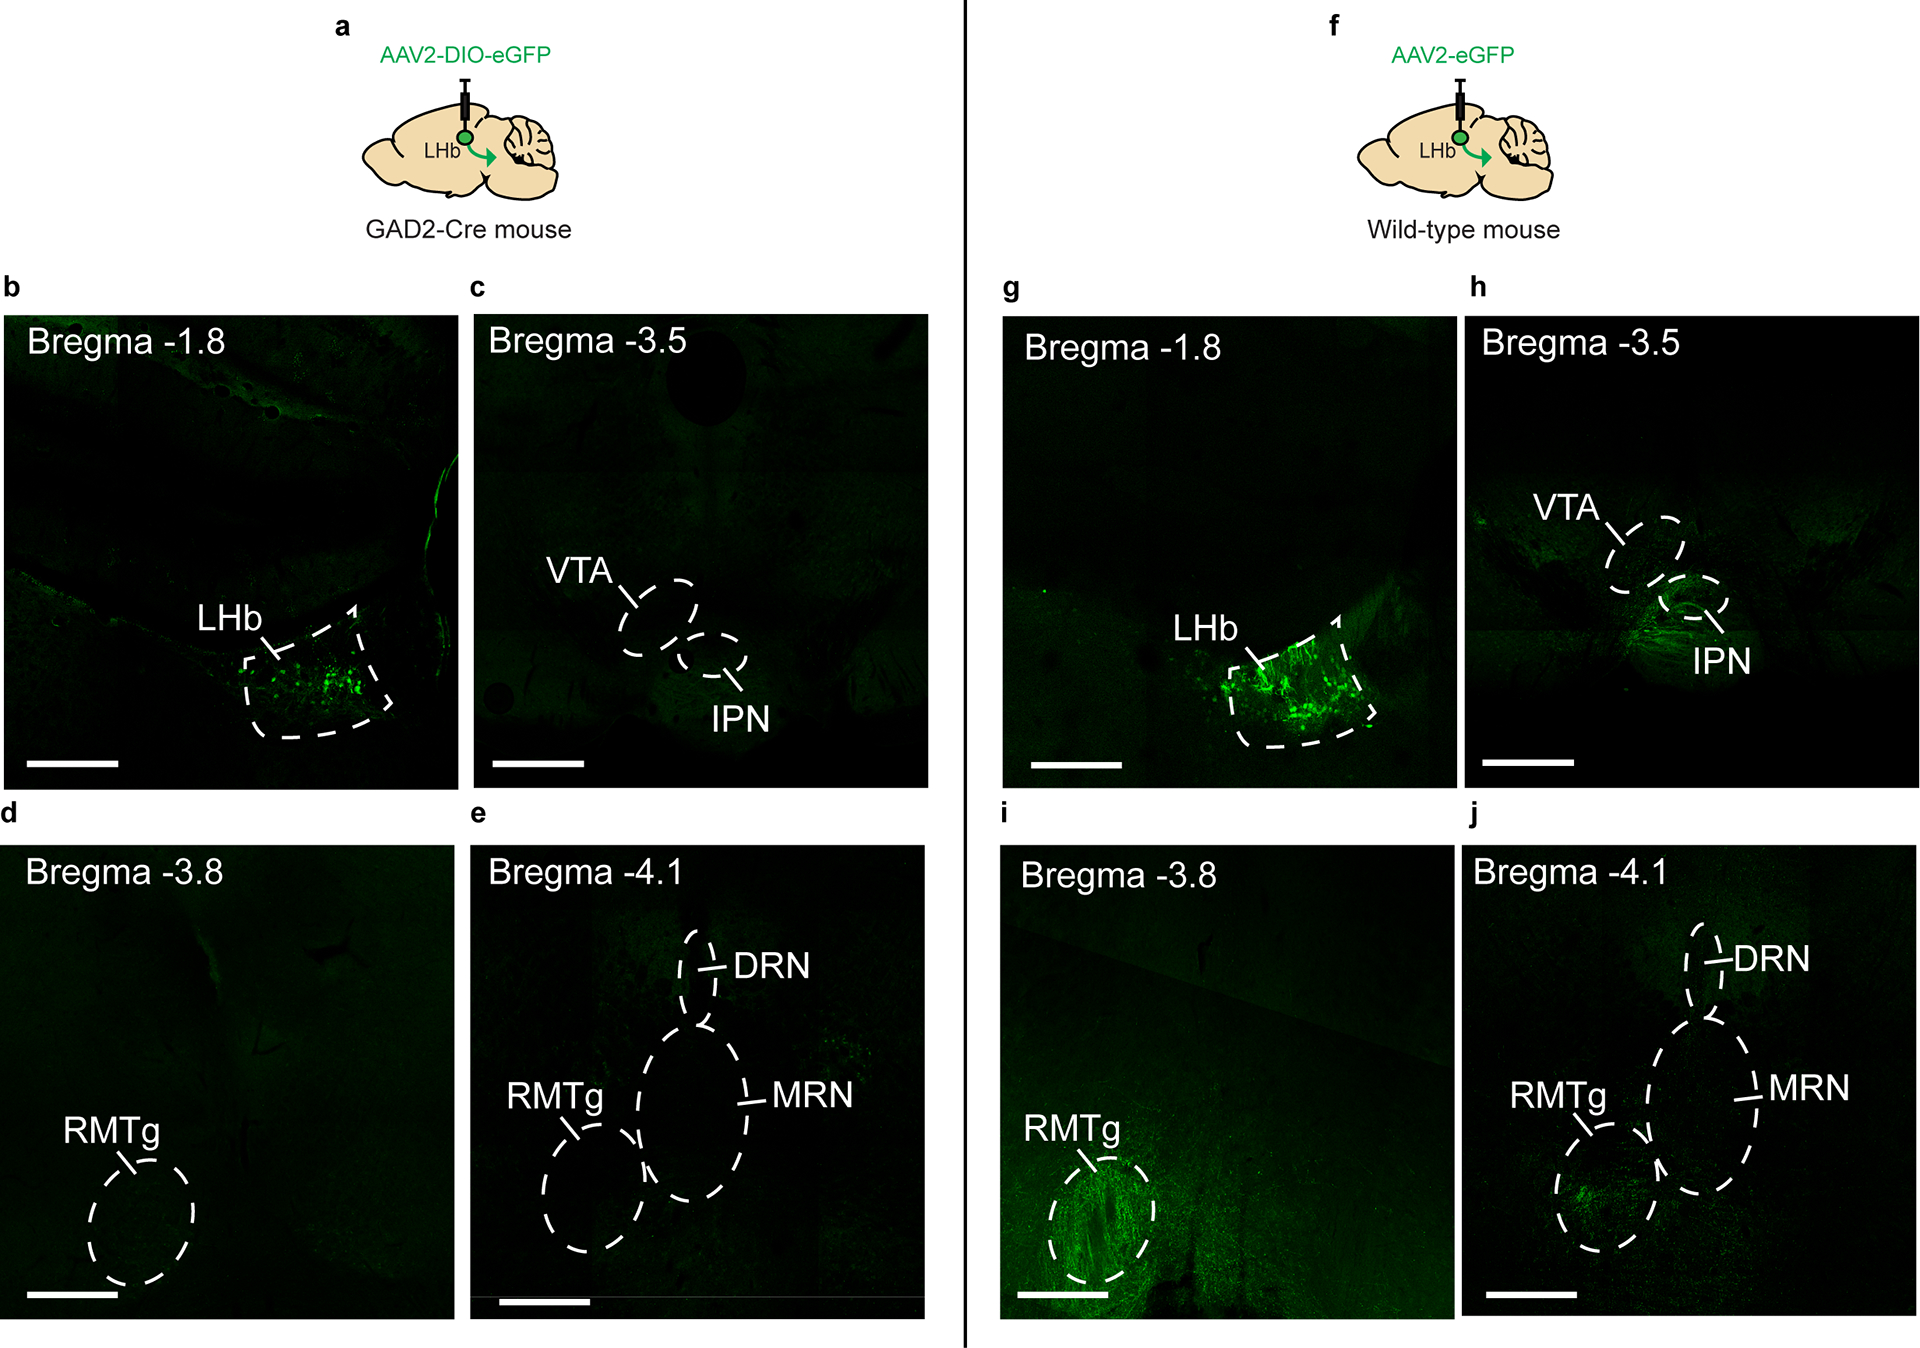
a, Schematic of surgical manipulations for anterograde tracing of GAD2 LHb neurons. b, Representative image of viral infection in GAD2 LHb neurons. Experimental images were obtained from 3 biologically independent mice, three slices per mouse, with similar results obtained. c, Representative image of the interpeduncular nucleus (IPN) and ventral tegmental area (VTA) in mice expressing eGFP in GAD2 LHb neurons. Experimental images were obtained from 3 biologically independent mice, three slices per mouse, with similar results obtained. d, Representative image of the rostromedial tegmental nucleus (RMTg) in mice expressing eGFP in GAD2 LHb neurons. Experimental images were obtained from 3 biologically independent mice, three slices per mouse, with similar results obtained. e, Representative image of the RMTg and anterior dorsal and median raphe nuclei (DRN and MRN) in mice expressing eGFP in GAD2 LHb neurons. Experimental images were obtained from 3 biologically independent mice, three slices per mouse, with similar results obtained. f, Schematic of surgical manipulations for non-conditional anterograde tracing of LHb neurons. g, Representative image of viral infection in LHb neurons. Experimental images were obtained from 3 biologically independent mice, three slices per mouse, with similar results obtained. h, Representative image of the interpeduncular nucleus (IPN) and ventral tegmental area (VTA) in mice expressing eGFP in LHb neurons. Experimental images were obtained from 3 biologically independent mice, three slices per mouse, with similar results obtained. i, Representative image of the rostromedial tegmental nucleus (RMTg) in mice expressing eGFP in LHb neurons. Experimental images were obtained from 3 biologically independent mice, three slices per mouse, with similar results obtained. j, Representative image of the RMTg and anterior dorsal and median raphe nuclei (DRN and MRN) in mice expressing eGFP in LHb neurons. Experimental images were obtained from 3 biologically independent mice, three slices per mouse, with similar results obtained. Scale bars= 500 μm.
Extended Data Fig. 4. RI behavior in NONs during optogenetic stimulation of OxR2 over-expression in LHb GAD2 neurons.
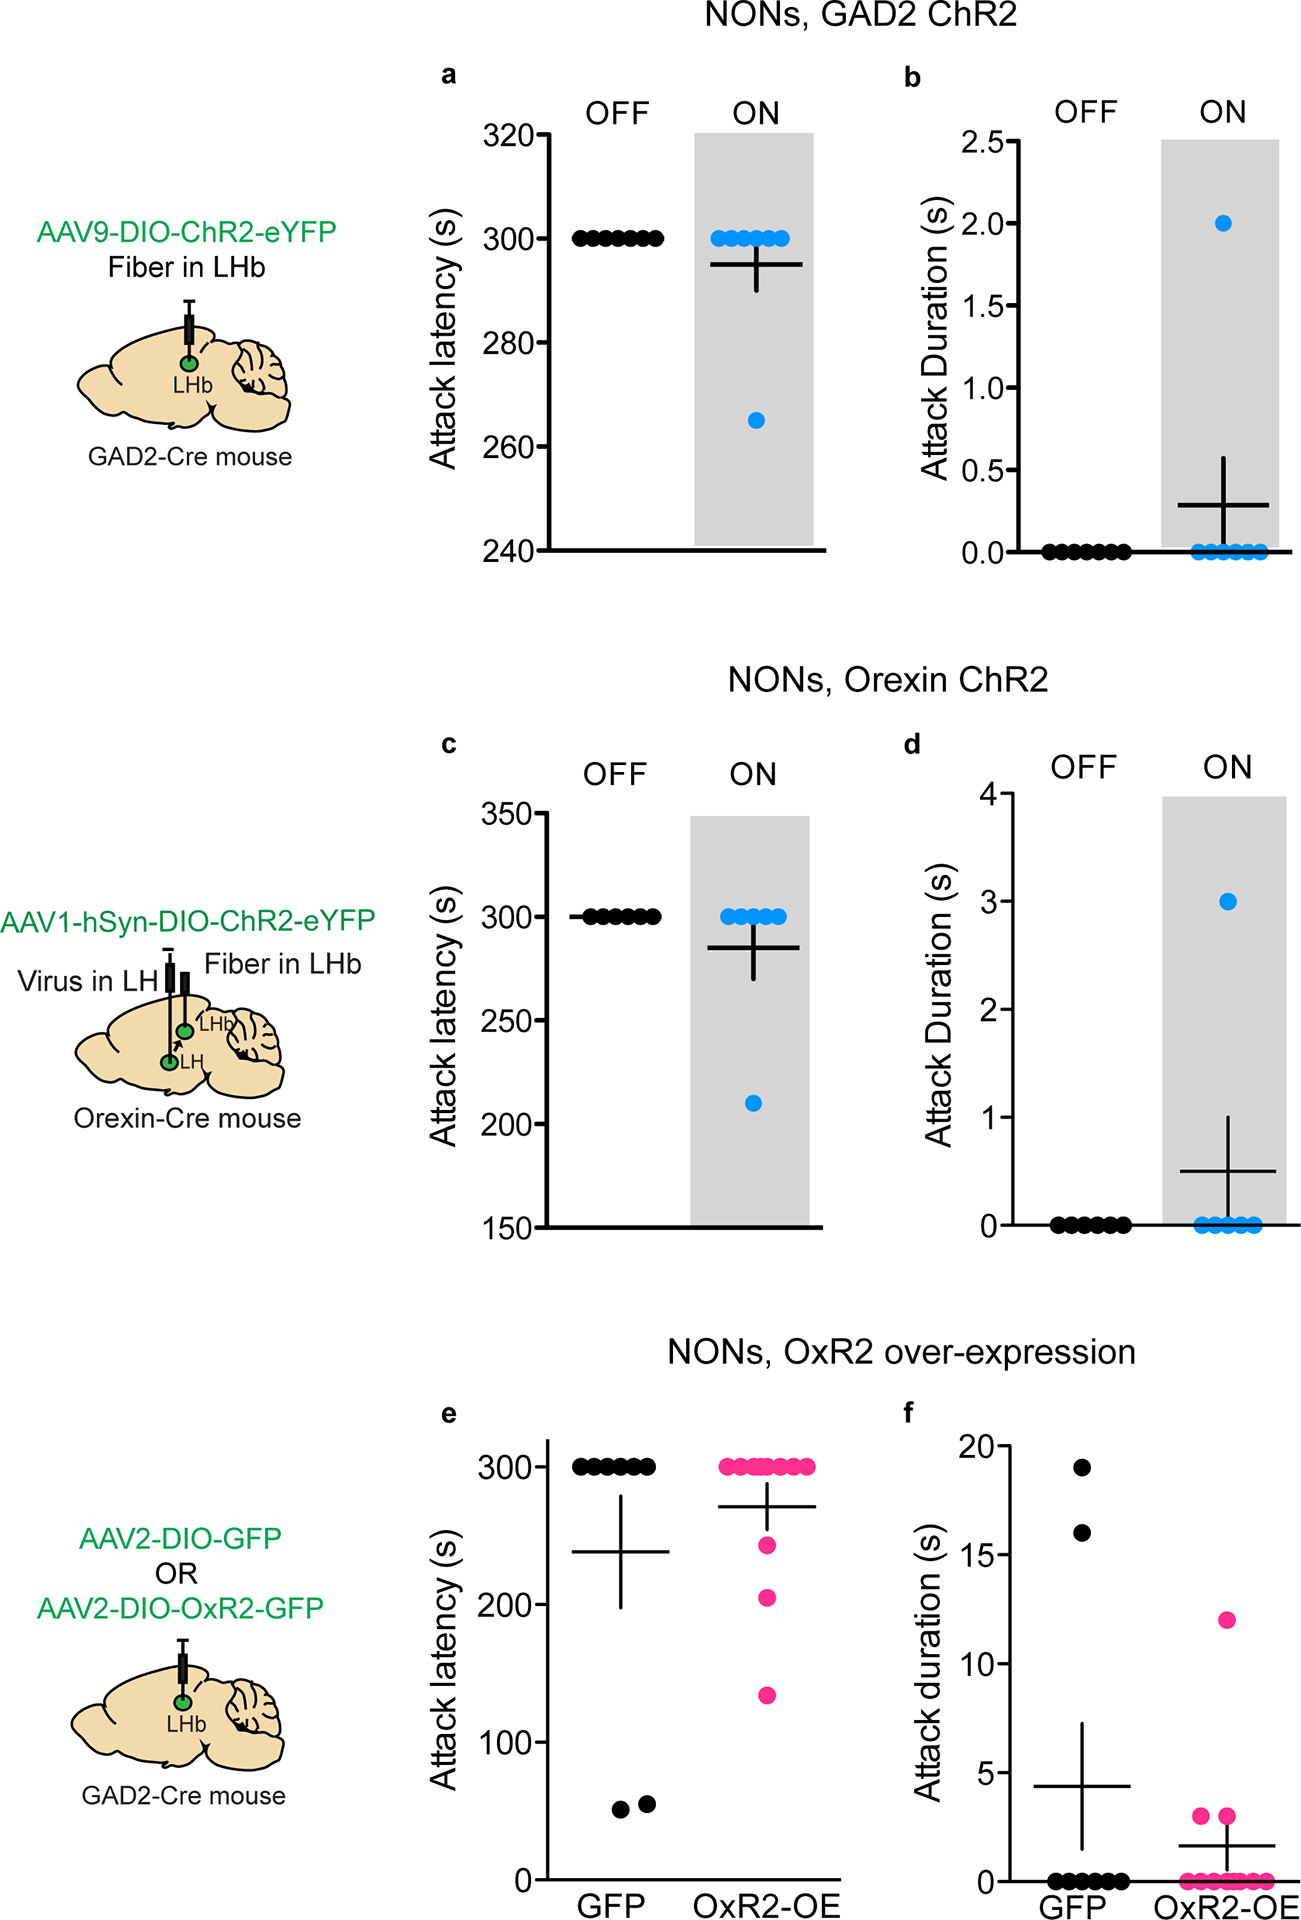
a, ChR2-mediated stimulation of GAD2 LHb neurons in NONs did not affect attack latency during RI (two-tailed paired t-test, n=7 biologically independent mice, t(6)=1.0, p=0.3559). b, ChR2-mediated stimulation of GAD2 LHb neurons in NONs did not affect attack duration during RI (two-tailed paired t-test, n=7 biologically independent mice, t(6)=1.0, p=0.3559). c, ChR2-mediated stimulation of orexin terminals in the LHb did not affect attack latency during RI (two-tailed paired t-test, n=6 biologically independent mice, t(5)=1.0, p=0.3632). d, ChR2-mediated stimulation of orexin terminals in the LHb did not affect attack duration during RI (two-tailed paired t-test, n=5 biologically independent mice, t(5)=1.0, p=0.3632). e, Over-expression of OxR2 in GAD2 LHb neurons in NONs did not affect attack latency during RI (two-tailed student’s t-test, n=8 biologically independent GFP mice and n=11 biologically independent OxR2-OE mice, t(17)=0.8338, p=0.4160). f, Over-expression of OxR2 in GAD2 LHb neurons in NONs did not affect attack duration during RI (two-tailed student’s t-test, n=8 biologically independent GFP mice and n=11 biologically independent OxR2-OE mice, t(17)=0.9951. All data are expressed as mean ± SEM.
Extended Data Fig. 5. Histology and 3D rendering of GAD2 LHb neurons and orexin axons.
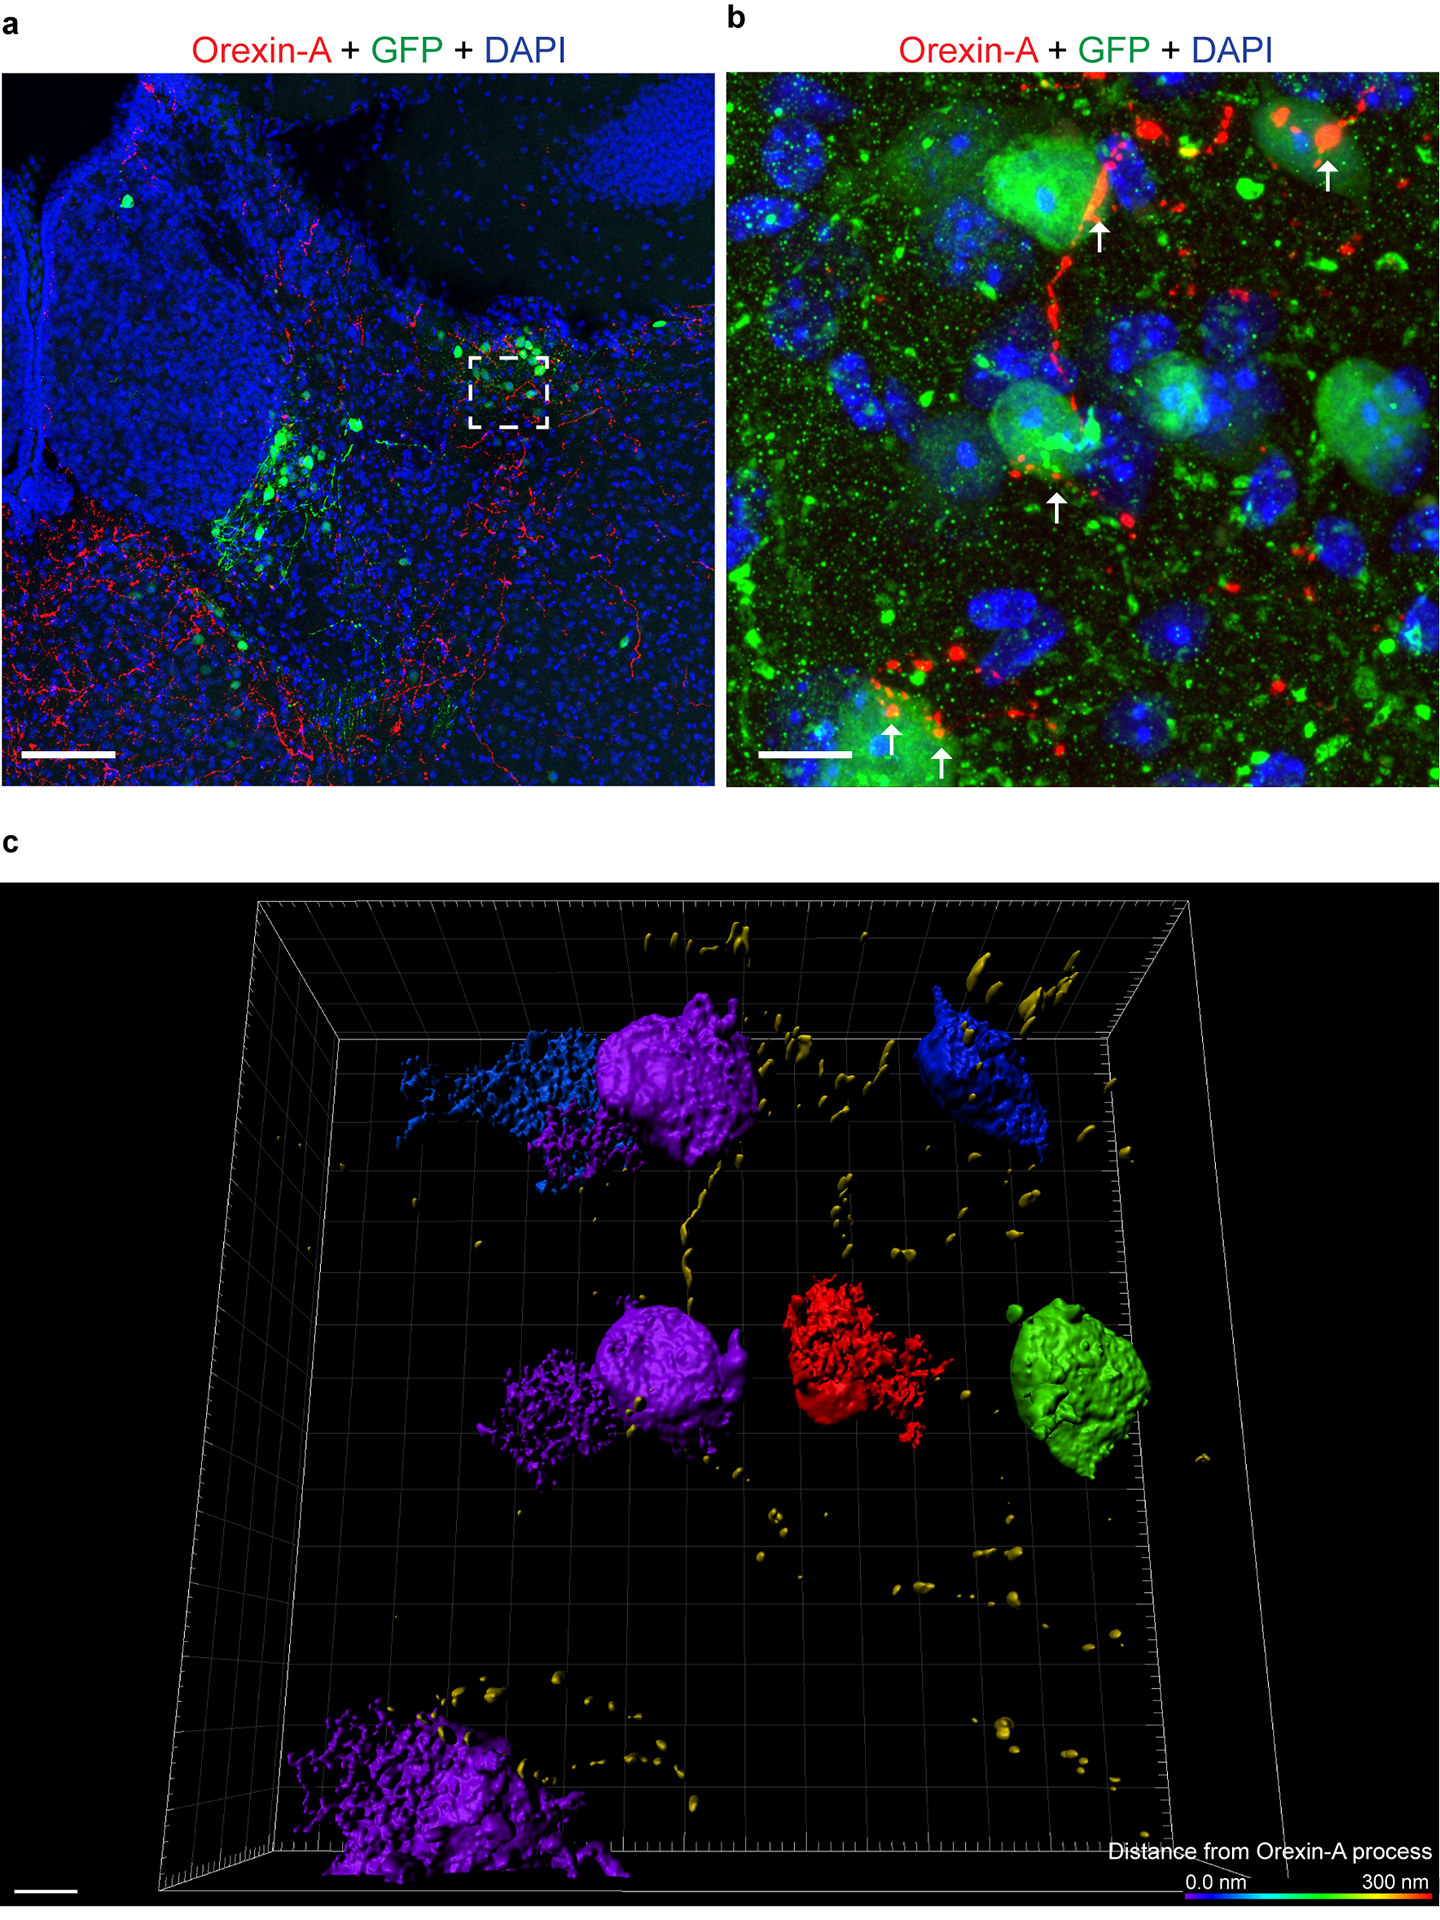
a, Immunohistochemistry for orexin-A (red), DAPI (blue), and eGFP (green) in a GAD2-Cre mouse injected with AAV-DIO-eGFP, scale bar = 300 μm. Experimental images were taken from 3 biologically independent mice, 3 slices per mouse, with similar results obtained. b, Immunohistochemistry for orexin-A (red), DAPI (blue), and GFP (green) in a GAD2-Cre mouse injected with AAV-DIO-eGFP, scale bar = 10 μm. Experimental images were taken from 3 biologically independent mice, 3 slices per mouse, with similar results obtained. c, 3D rendering of image in b, color of GAD2 neuron coincides with estimated distance from orexin-A axon according to key in lower right corner, scale bar = 5 μm. Experimental images were taken from 3 biologically independent mice, 3 slices per mouse, with similar results obtained.
Extended Data Fig. 6. Attack latencies for AGGs and NONs used in qPCR and ISH experiments.
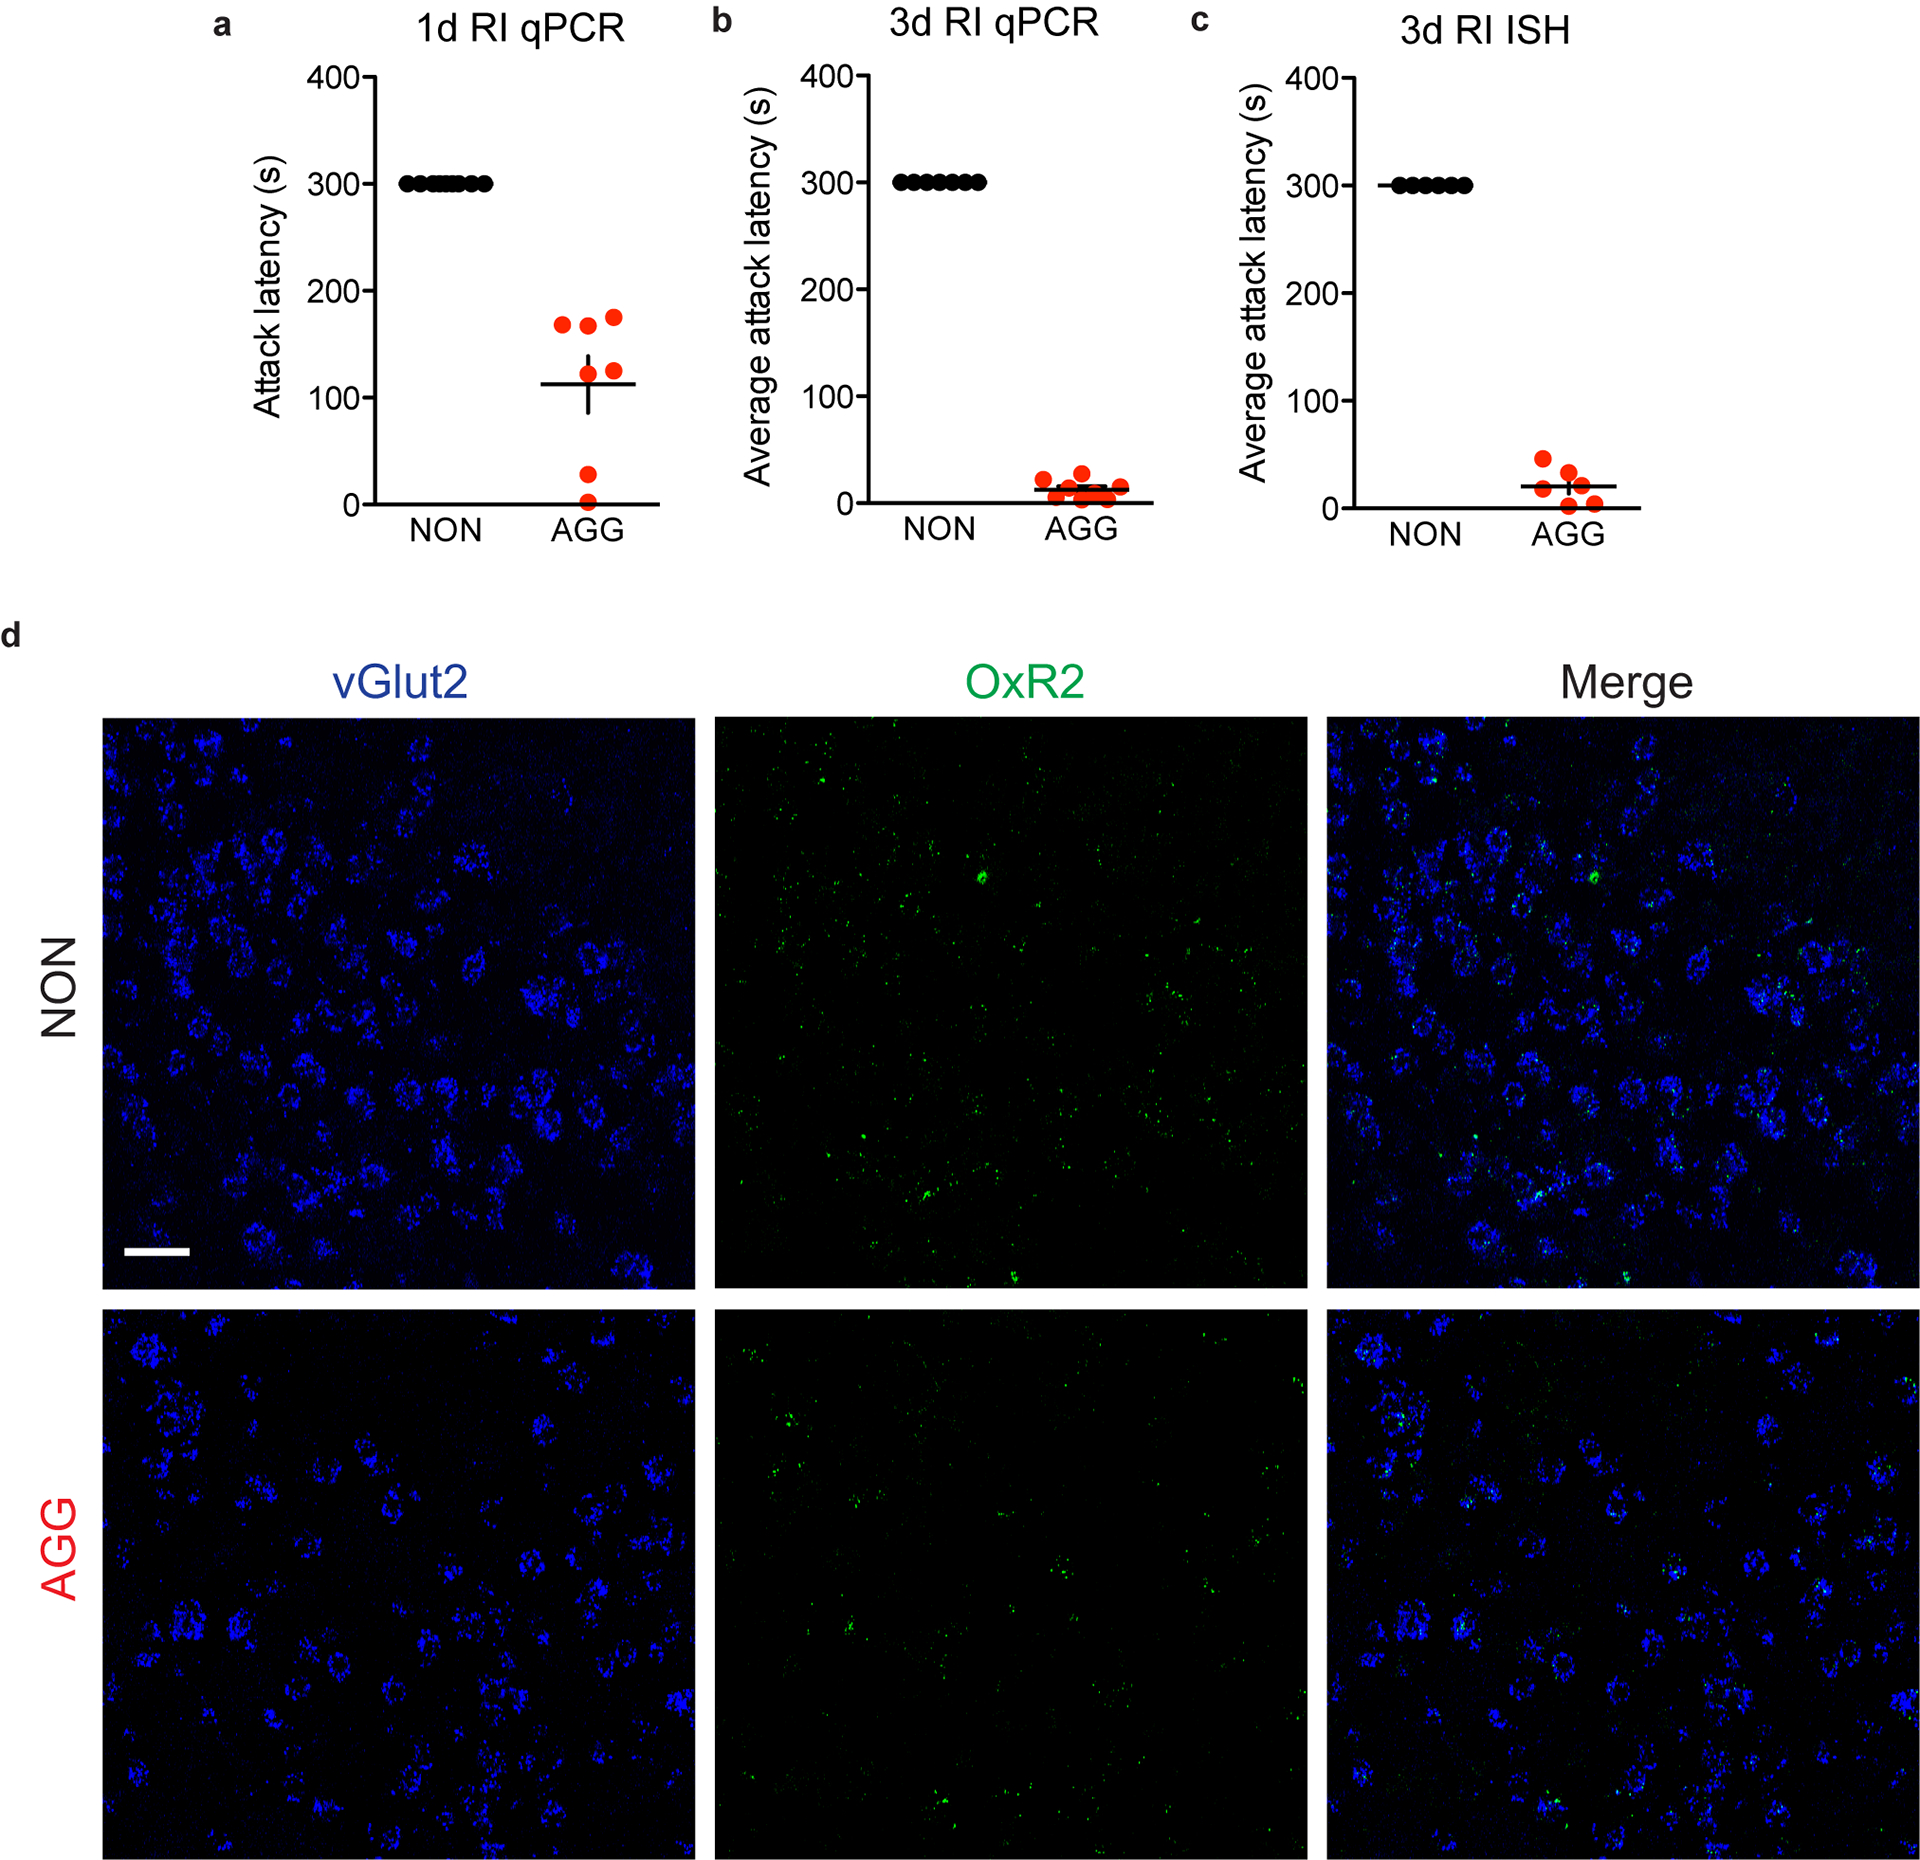
a, Attack latency for one day of RI in mice used for LHb qPCR, n=9 biologically independent NON mice, n=7 biologically independent AGG mice. b, Average attack latency for three days of RI in mice used for LHb qPCR, n=7 biologically independent NON mice, n=8 biologially independent AGG mice. c, Average attack latency for three days of RI in mice used for LHb OxR2 ISH, n=6 biologically independent NON mice, n=6 biologically independent AGG mice. d, Representative images from OxR2 ISH in AGG and NON LHb vGlut2 neurons following RI, accompanies Fig. 5j, scale bar = 20 μm. Notably, OxR2 expression was barely detectable in these neurons in AGGs or NONs, which is in line with our findings showing low OxR2 expression in vGlut2 neurons in Fig. 5b–c. Experimental images were taken from 12 biologically independent mice, 2 slices per mouse, with similar results obtained. All data are expressed as mean ± SEM.
Extended Data Fig. 7. Effects of systemic antagonism of OxR2 with EMPA on aggression and LHb activity.
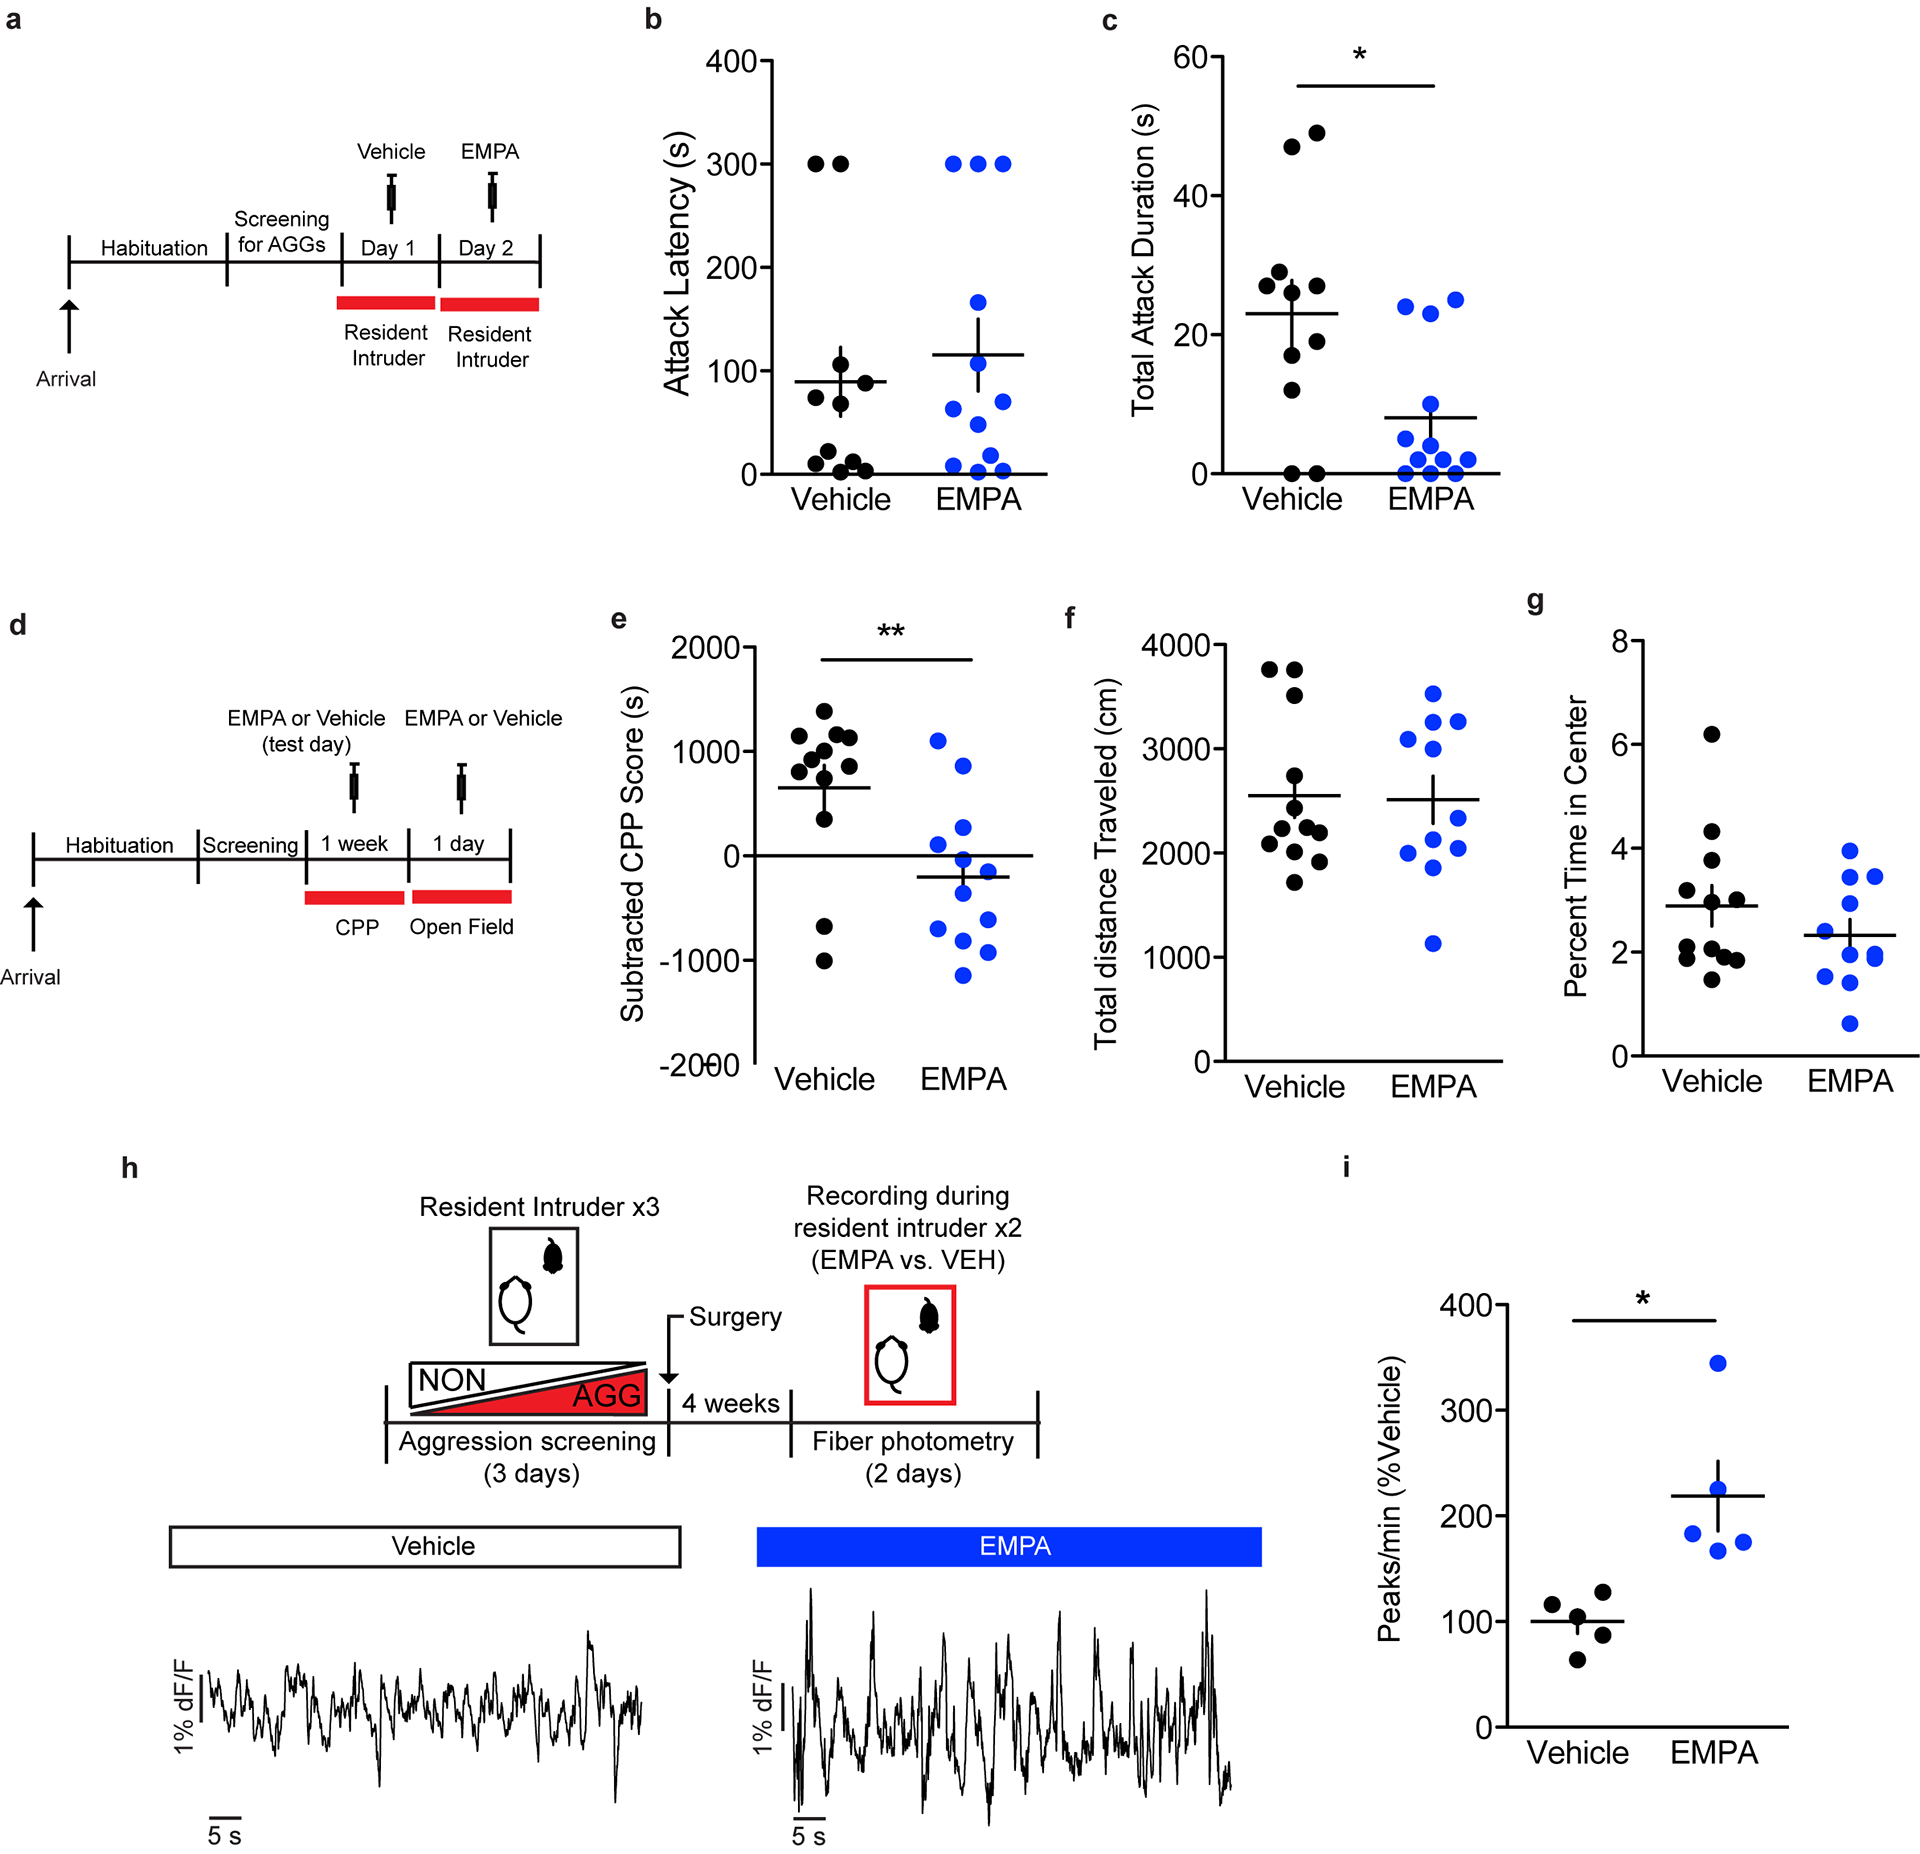
a, Experimental scheme for OxR2 systemic antagonism RI experiment. b, RI test attack latency in animals treated with EMPA and vehicle (two-tailed paired t-test, n=11 biologically independent mice per group, t(10)=0.3215, p=0.758). c, RI test attack duration in animals treated with EMPA and vehicle (two-tailed paired t-test, n=11 biologically independent mice per group, t(10)=2.888, p=0.016).d, Experimental scheme for OxR2 systemic antagonism aggression CPP and locomotion experiments. e, Aggression CPP for animals treated with EMPA and vehicle (two-tailed student’s t-test, n=12 biologically independent vehicle mice and n=11 biologically independent EMPA mice, t(21)=2.885, p=0.0086). f, Locomotor activity in the open field for animals treated with EMPA and vehicle (two-tailed student’s t-test, n=12 biologically independent vehicle mice and n=11 biologically independent EMPA mice, t(21)=0.1301, p=0.8991). g, Anxiety-related behavior in the open field for animals treated with EMPA or vehicle (two-tailed student’s t-test, n=11 biologically independent mice per group, t(21)=1.134, p=0.2695) h, Representative fiber photometry traces in an animal treated with vehicle and EMPA. i, LHb GCaMP peaks during RI during vehicle and EMPA treatment (two-tailed paired t-test, n=5 biologically independent mice, t(4)=2.946, p=0.0421). *p<0.05, **p<0.01. All data are expressed as mean ± SEM.
Extended Data Fig. 8. LHb orexin-ChR2 experiments supporting data.
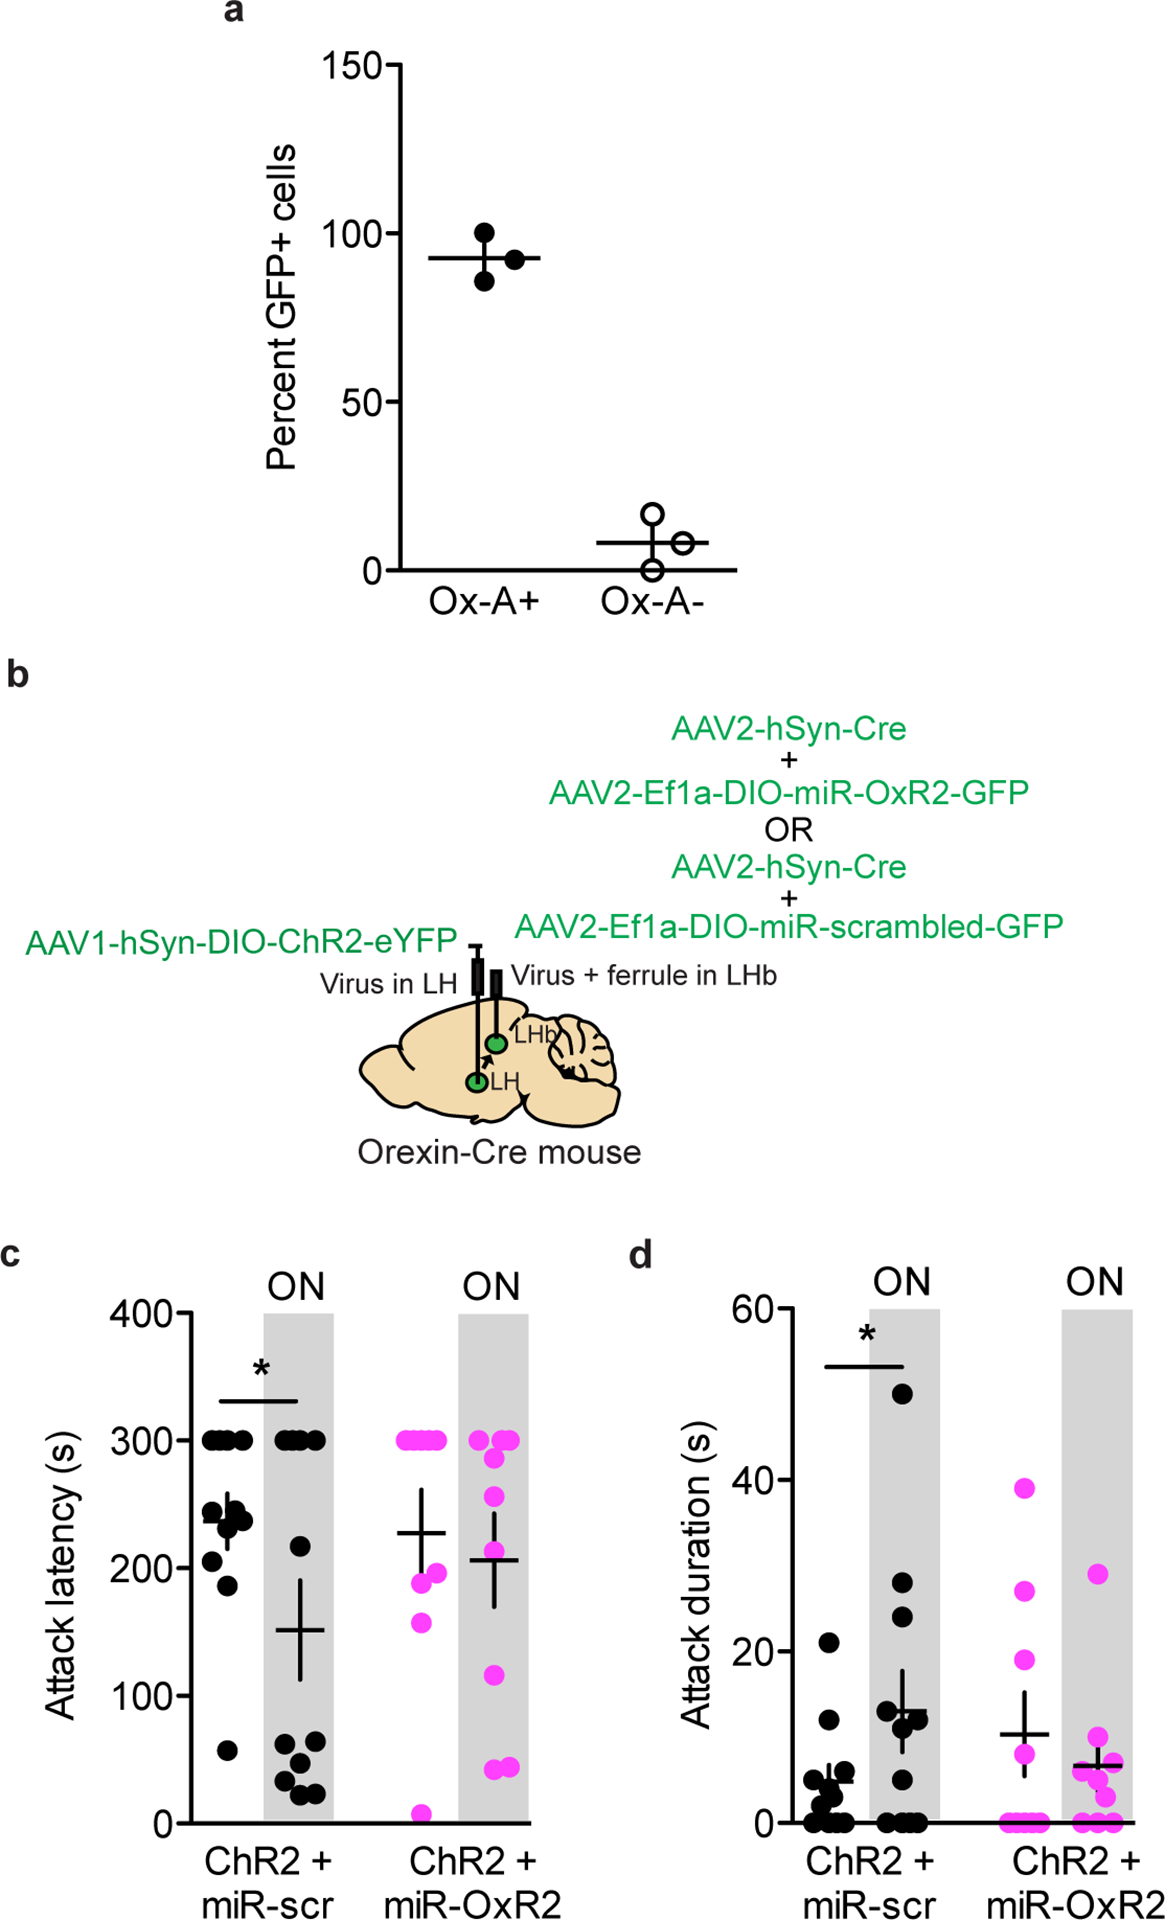
a, >90% of neurons infected with AAV1-DIO-YFP were positive for orexin-A protein as determined by immunohistochemistry, n=3 biologically independent mice, 3 slices per mouse. b, Surgical manipulations for ChR2-mediated activation of orexin terminals in the LHb with concurrent knockdown of LHb OxR2. c, Optogenetic stimulation of orexin terminals in the LHb reduced attack latency in mice treated with the miR-scrambed virus, but not the miR-OxR2 virus (two-tailed paired t-test, miR-scrambled: n=11 biologially independent mice, t(10)=2.424, p=0.0358; miR-OxR2: n=9 biologically independent mice, t(8)=0.5281, p=0.6117). d, Optogenetic stimulation of orexin terminals in the LHb increased attack duration in mice treated with the miR-scrambled virus, but not the miR-OxR2 virus (two-tailed paired t-test, miR-scrambled: n=11 biologically independent mice, t(10)=2.260, p=0.0474; miR-OxR2: n=9 biologically independent mice, t(8)=0.8493, p=0.4204). *p<0.05. All data are expressed as mean ± SEM.
Extended Data Fig. 9. In-vitro and in-vivo validation of AAV-DIO-miR-OxR2 virus.
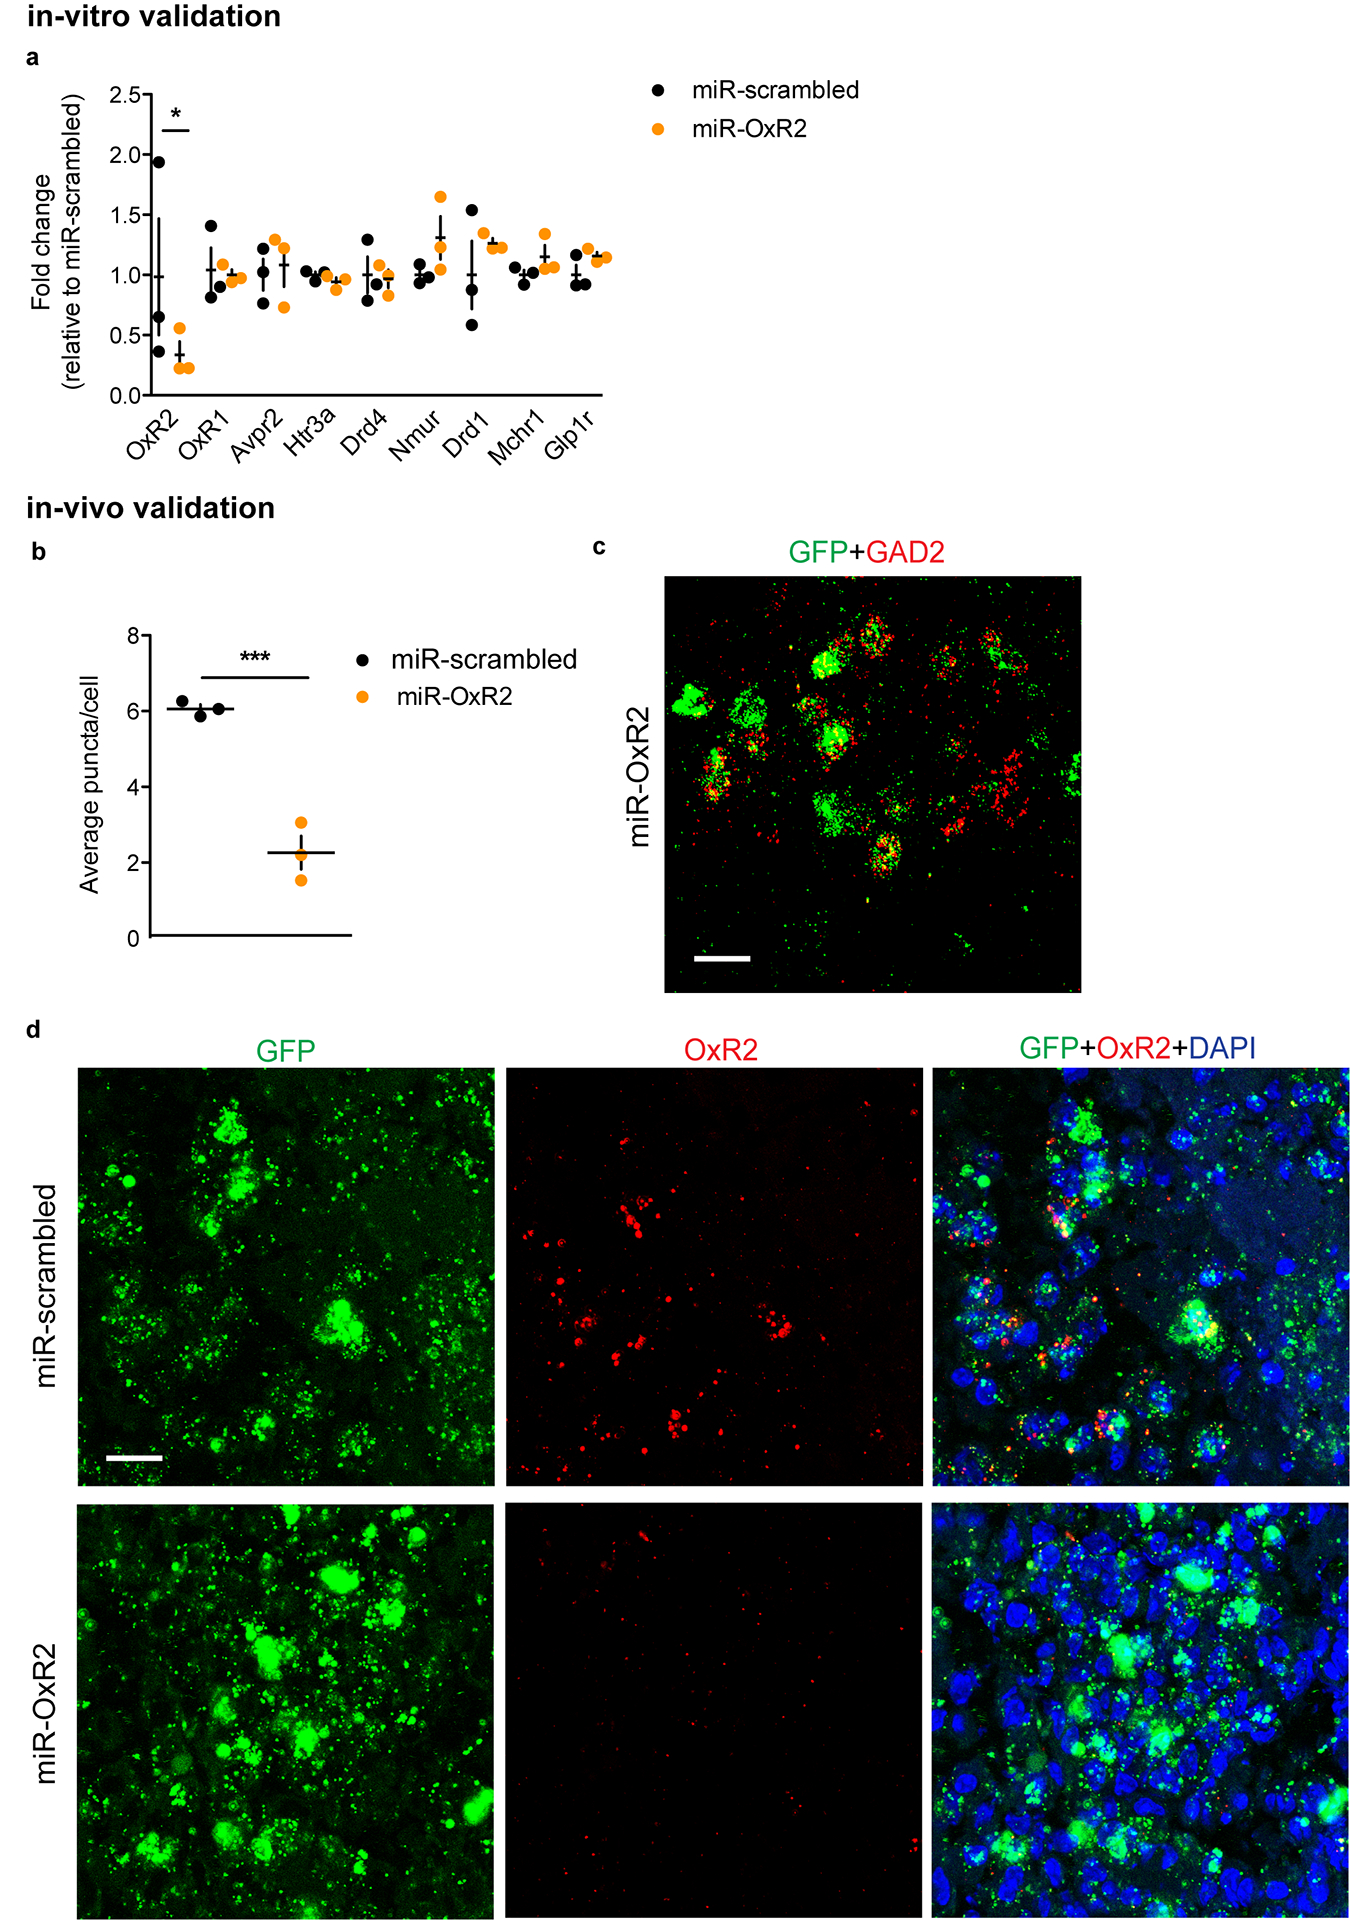
a, N2A cells treated with miR-OxR2 construct selectively reduced OxR2 expression compared to cells treated with miR-scrambled construct, but did not reduce expression of related transcripts (two-tailed student’s t-test, n=3 biologically independent plates per group, 3 replicates per plate; OxR2: t(4)=2.402, p=0.0482; OxR1: t(4)=0.2123, p=0.8423; Avpr2: t(4)=0.3686, p=0.7311; Htr3a: t(4)=1.309, p=0.2607; Drd4: t(4)=0.1925, p=0.8567; Nmur: t(4)=1.672, p=0.1699; Drd1: t(4)=0.9239, p=0.4078; Mchr1: t(4)=1.467, p=0.2163; Glpr1: t(4)=1.785, p=0.1488). b, GAD2-Cre mice injected with AAV-DIO-miR-OxR2 displayed reduced expression of OxR2 compared to mice injected with AAV-DIO-miR-scrambled as determined by ISH (two-tailed student’s t-test, n=3 mice, 2 slices per mouse, t(4)=18.44, p=0.0001). c, Representative image of GFP expression localized to GAD2 LHb neurons in GAD2-Cre mice injected with AAV-DIO-miR-OxR2, scale bar = 25 μm. Experimental images were obtained from 6 biologically independent mice, 2 slices per mouse, with similar results obtained. d, Representative images of OxR2 expression in GAD2 LHb neurons infected with AAV-DIO-miR-OxR2 or AAV-DIO-miR-scrambled, scale bar, 20 μm. *p<0.05, ***p<0.001. All data are expressed as mean ± SEM.
Extended Data Fig. 10. In-vitro and in-vivo validation of AAV-DIO-OxR2 over-expression virus.
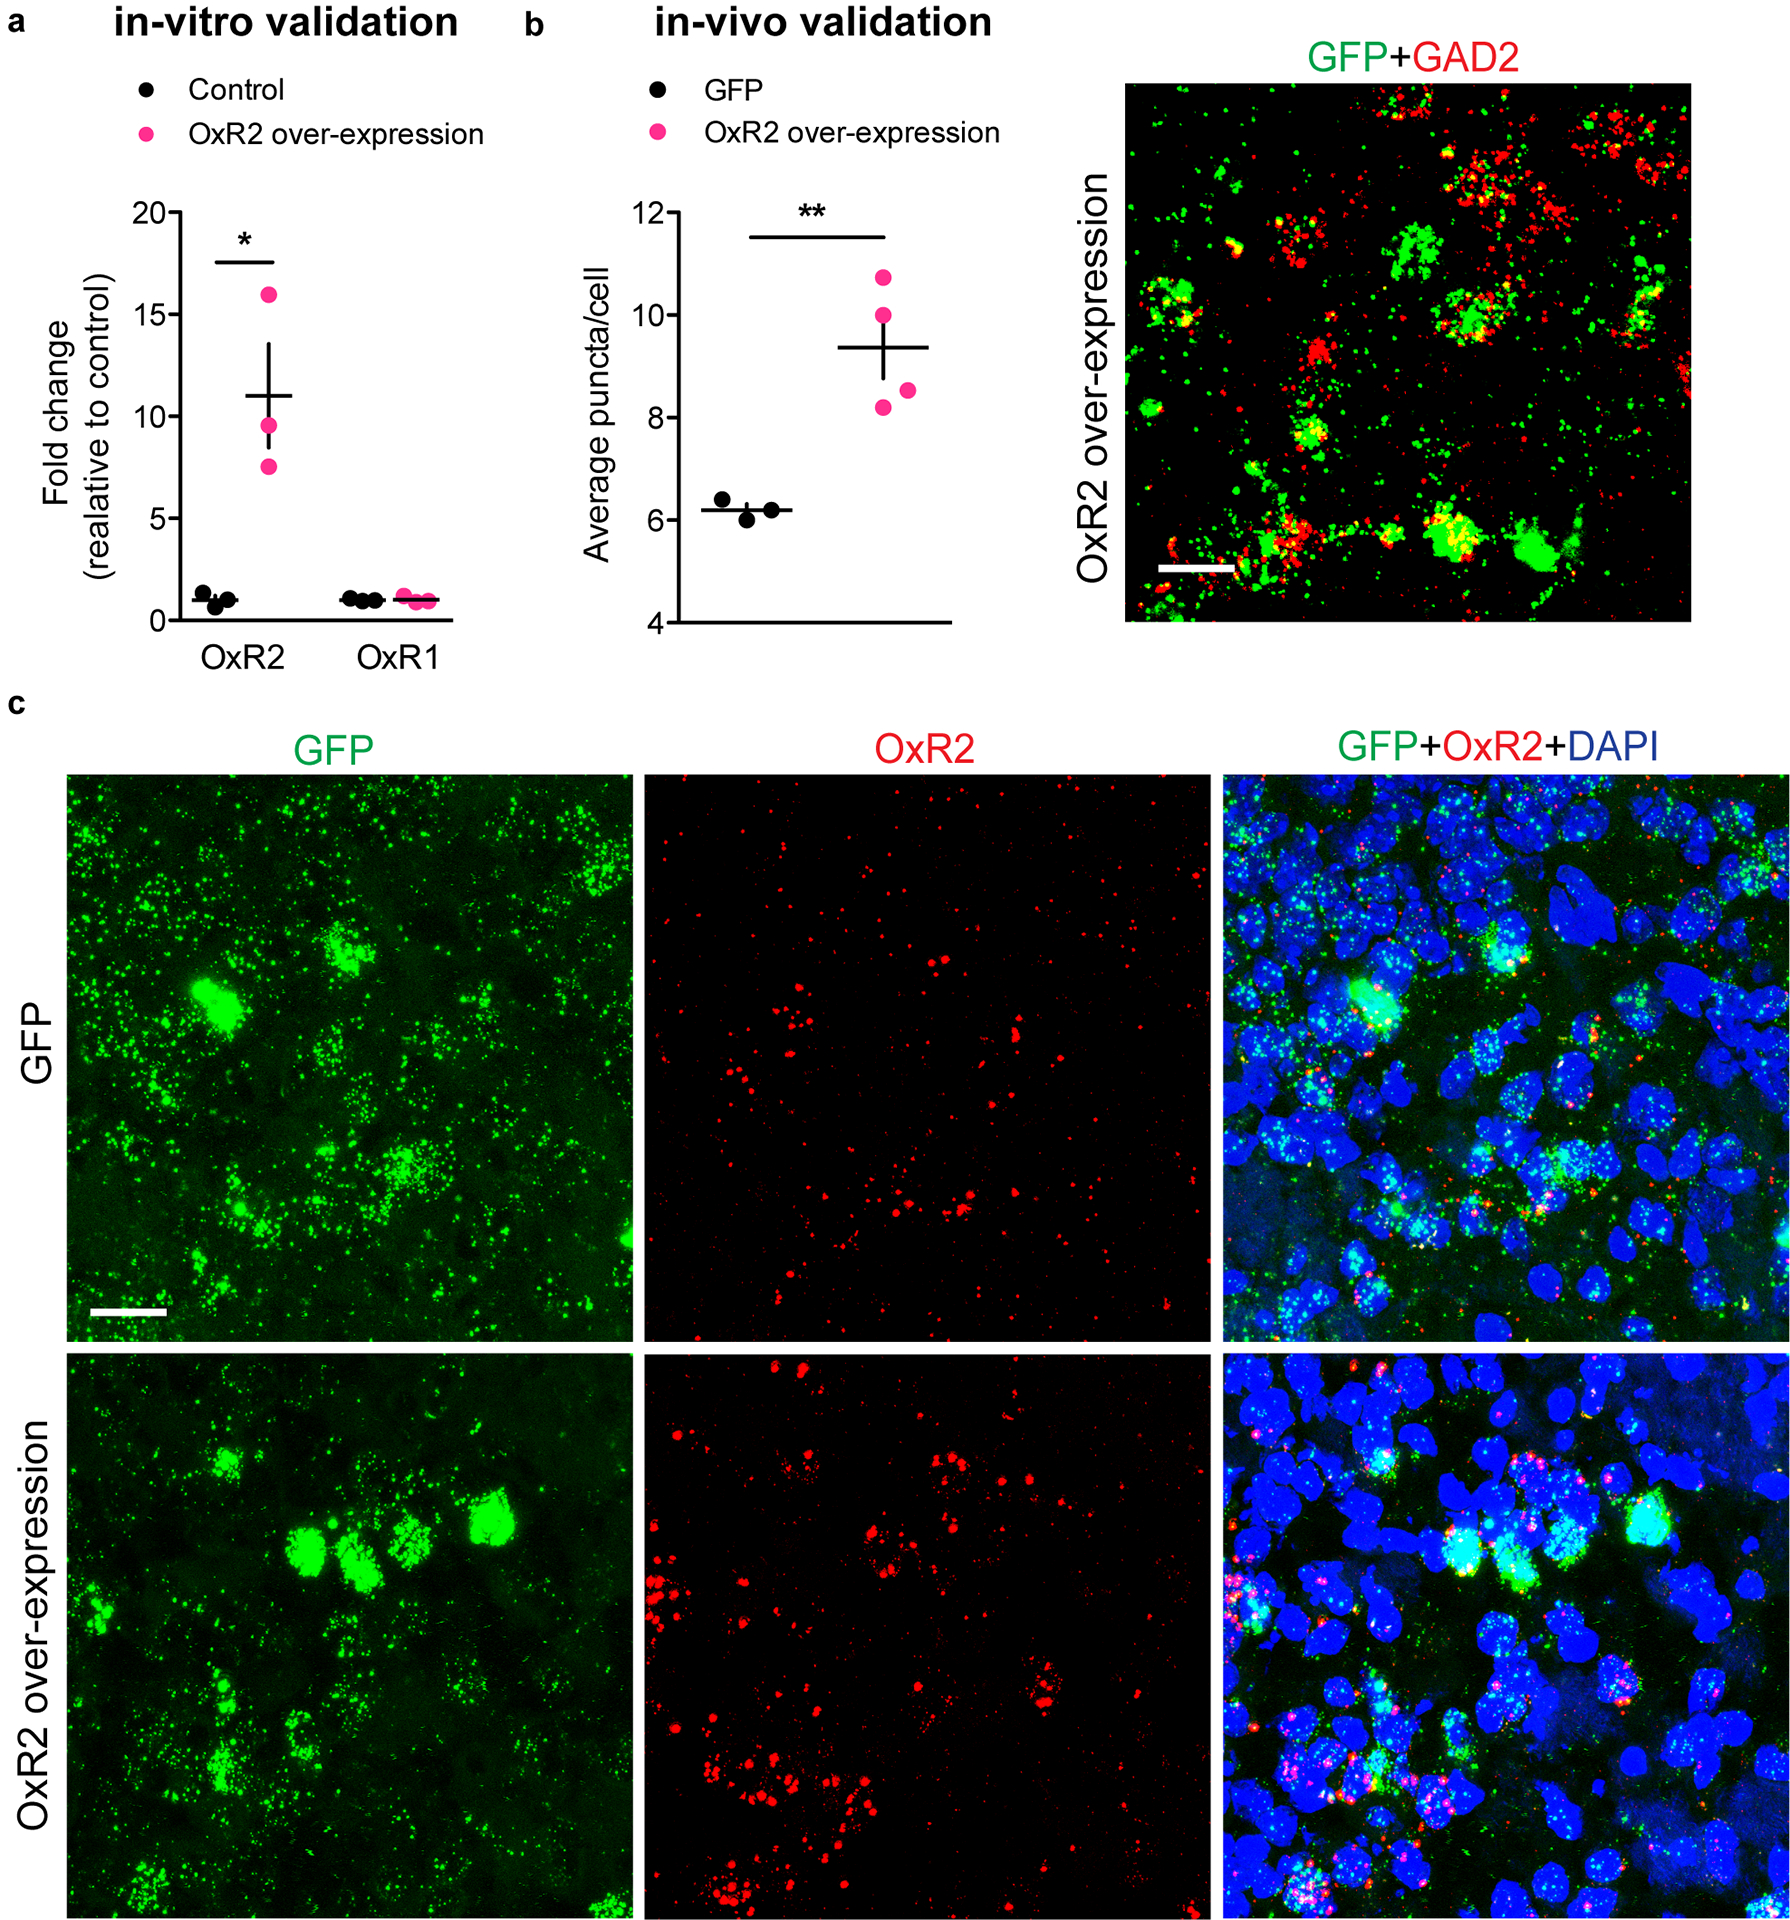
a, N2A cells treated with OxR2 over-expression construct selectively increased OxR2 expression compared to controls (two-tailed student’s t-test, n=3 biologically independent plates per group, 3 replicates per plate, OxR2: t(4)=3.939, p=0.0171; OxR1: t(4)=0.1238, p=0.9075). b, GAD2-Cre mice injected with AAV-DIO-OxR2 displayed increased expression of OxR2 compared to mice injected with AAV-DIO-GFP as determined by ISH (two-tailed student’s t-test, n=3 biologically independent mice, 2 slices per mouse, t(4)=4.417, p=0.0069) (left). Representative image of GFP expression localized to GAD2 LHb neurons in GAD2-Cre mice injected with AAV-DIO-OxR2, scale bar = 25 μm (right). Experimental images were obtained from 7 biologically independent mice, 2 slices per mouse, with similar results obtained. c, Representative images of OxR2 expression in GAD2 LHb neurons infected with AAV-DIO-OxR2 or AAV-DIO-GFP, scale bar = 25 μm. *p<0.05, **p<0.01. Experimental images were taken from 7 biologically independent mice, 2 slices per mouse, with similar results obtained. All data are expressed as mean ± SEM.
Supplementary Material
Acknowledgements
The authors would like to thank Susie Feng and Carmen Ferrer for their assistance with histology, Nikos Tzvaras for his assistance with microscopy, and Virovek Inc. for cloning and packaging of AAV viruses. This work was supported by NIH grants 1R01MH114882-01 (S.J.R.), 2R01MH090264-06 (S.J.R.), P50 MH096890 and P50 AT008661 (S.J.R.) F31 MH111108-01A1 (M.E.F.), T32 MH096678 (M.E.F.), T32 MH087004 (M.E.F.), and R01 MH51399 (E.J.N.).
Footnotes
Competing Interests Statement
S.J.R. and M.E.F. have a patent pending (US Patent Application 62/11,233) for the use of OxR2 antagonists to treat aggression.
References
- 1.Hill AP, et al. Aggressive Behavior Problems in Children with Autism Spectrum Disorders: Prevalence and Correlates in a Large Clinical Sample. Research in autism spectrum disorders 8, 1121–1133 (2014). [DOI] [PMC free article] [PubMed] [Google Scholar]
- 2.Cha J, et al. Neural Correlates of Aggression in Medication-Naive Children with ADHD: Multivariate Analysis of Morphometry and Tractography. Neuropsychopharmacology 40, 1717–1725 (2015). [DOI] [PMC free article] [PubMed] [Google Scholar]
- 3.Anderson NE & Kiehl KA Psychopathy and aggression: when paralimbic dysfunction leads to violence. Curr Top Behav Neurosci 17, 369–393 (2014). [DOI] [PMC free article] [PubMed] [Google Scholar]
- 4.Miles SR, Menefee DS, Wanner J, Teten Tharp A & Kent TA The Relationship Between Emotion Dysregulation and Impulsive Aggression in Veterans With Posttraumatic Stress Disorder Symptoms. J Interpers Violence 31, 1795–1816 (2016). [DOI] [PubMed] [Google Scholar]
- 5.May ME Aggression as positive reinforcement in people with intellectual disabilities. Research in developmental disabilities 32, 2214–2224 (2011). [DOI] [PubMed] [Google Scholar]
- 6.Moran JK, Weierstall R & Elbert T Differences in brain circuitry for appetitive and reactive aggression as revealed by realistic auditory scripts. Front Behav Neurosci 8, 425 (2014). [DOI] [PMC free article] [PubMed] [Google Scholar]
- 7.Nell V Cruelty’s rewards: the gratifications of perpetrators and spectators. Behav Brain Sci 29, 211–224; discussion 224–257 (2006). [DOI] [PubMed] [Google Scholar]
- 8.Falkner AL, Grosenick L, Davidson TJ, Deisseroth K & Lin D Hypothalamic control of male aggression-seeking behavior. Nat Neurosci 19, 596–604 (2016). [DOI] [PMC free article] [PubMed] [Google Scholar]
- 9.Golden SA, et al. Basal forebrain projections to the lateral habenula modulate aggression reward. Nature 534, 688–692 (2016). [DOI] [PMC free article] [PubMed] [Google Scholar]
- 10.Flanigan M, Aleyasin H, Takahashi A, Golden SA & Russo SJ An emerging role for the lateral habenula in aggressive behavior. Pharmacology, biochemistry, and behavior 162, 79–86 (2017). [DOI] [PMC free article] [PubMed] [Google Scholar]
- 11.Matsumoto M & Hikosaka O Lateral habenula as a source of negative reward signals in dopamine neurons. Nature 447, 1111–1115 (2007). [DOI] [PubMed] [Google Scholar]
- 12.Baker PM, et al. The Lateral Habenula Circuitry: Reward Processing and Cognitive Control. J Neurosci 36, 11482–11488 (2016). [DOI] [PMC free article] [PubMed] [Google Scholar]
- 13.Lawson RP, et al. Disrupted habenula function in major depression. Mol Psychiatry 22, 202–208 (2017). [DOI] [PMC free article] [PubMed] [Google Scholar]
- 14.Ranft K, et al. Evidence for structural abnormalities of the human habenular complex in affective disorders but not in schizophrenia. Psychol Med 40, 557–567 (2010). [DOI] [PubMed] [Google Scholar]
- 15.Chou MY, et al. Social conflict resolution regulated by two dorsal habenular subregions in zebrafish. Science 352, 87–90 (2016). [DOI] [PubMed] [Google Scholar]
- 16.Brinschwitz K, et al. Glutamatergic axons from the lateral habenula mainly terminate on GABAergic neurons of the ventral midbrain. Neuroscience 168, 463–476 (2010). [DOI] [PubMed] [Google Scholar]
- 17.Hashikawa Y, et al. Transcriptional and Spatial Resolution of Cell Types in the Mammalian Habenula. bioRxiv, 772376 (2019). [DOI] [PMC free article] [PubMed] [Google Scholar]
- 18.Zhang L, et al. A GABAergic cell type in the lateral habenula links hypothalamic homeostatic and midbrain motivation circuits with sex steroid signaling. Transl Psychiatry 8, 50 (2018). [DOI] [PMC free article] [PubMed] [Google Scholar]
- 19.Peyron C, et al. Neurons containing hypocretin (orexin) project to multiple neuronal systems. J Neurosci 18, 9996–10015 (1998). [DOI] [PMC free article] [PubMed] [Google Scholar]
- 20.Tsunematsu T, et al. Acute Optogenetic Silencing of Orexin/Hypocretin Neurons Induces Slow-Wave Sleep in Mice. J Neurosci 31 (2011). [DOI] [PMC free article] [PubMed] [Google Scholar]
- 21.Blouin AM, et al. Human hypocretin and melanin concentrating hormone levels are linked to emotion and social interaction. Nat Commun 4, 1547 (2013). [DOI] [PMC free article] [PubMed] [Google Scholar]
- 22.Harris GC, Wimmer M & Aston-Jones G A role for lateral hypothalamic orexin neurons in reward seeking. Nature 437, 556–559 (2005). [DOI] [PubMed] [Google Scholar]
- 23.Muschamp JW, et al. Hypocretin (orexin) facilitates reward by attenuating the antireward effects of its cotransmitter dynorphin in ventral tegmental area. Proc Natl Acad Sci U S A 111, E1648–1655 (2014). [DOI] [PMC free article] [PubMed] [Google Scholar]
- 24.Quarta D & Smolders I Rewarding, reinforcing and incentive salient events involve orexigenic hypothalamic neuropeptides regulating mesolimbic dopaminergic neurotransmission. Eur J Pharm Sci 57, 2–10 (2014). [DOI] [PubMed] [Google Scholar]
- 25.Richardson KA & Aston-Jones G Lateral hypothalamic orexin/hypocretin neurons that project to VTA are differentially activated with morphine preference. J Neurosci 32, 3809–3817 (2012). [DOI] [PMC free article] [PubMed] [Google Scholar]
- 26.Tung LW, et al. Orexins contribute to restraint stress-induced cocaine relapse by endocannabinoid-mediated disinhibition of dopaminergic neurons. in Nat Commun 7, 12199 (2016). [DOI] [PMC free article] [PubMed] [Google Scholar]
- 27.Schwartzer JJ, Ricci LA & Melloni RH Jr. Prior fighting experience increases aggression in Syrian hamsters: implications for a role of dopamine in the winner effect. Aggress Behav 39, 290–300 (2013). [DOI] [PubMed] [Google Scholar]
- 28.Trusel M, et al. Punishment-Predictive Cues Guide Avoidance through Potentiation of Hypothalamus-to-Habenula Synapses. Neuron (2019). [DOI] [PubMed] [Google Scholar]
- 29.Lazaridis I, et al. A hypothalamus-habenula circuit controls aversion. Molecular Psychiatry (2019). [DOI] [PMC free article] [PubMed] [Google Scholar]
- 30.Takahashi A, et al. Glutamate input in the dorsal raphe nucleus as a determinant of escalated aggression in male mice. J Neurosci 35, 6452–6463 (2015). [DOI] [PMC free article] [PubMed] [Google Scholar]
- 31.Yu Q, et al. Dopamine and serotonin signaling during two sensitive developmental periods differentially impact adult aggressive and affective behaviors in mice. Mol Psychiatry 19, 688–698 (2014). [DOI] [PMC free article] [PubMed] [Google Scholar]
- 32.Wersinger SR, Ginns EI, O’Carroll AM, Lolait SJ & Young Iii WS Vasopressin V1b receptor knockout reduces aggressive behavior in male mice. Molecular Psychiatry 7, 975 (2002). [DOI] [PubMed] [Google Scholar]
- 33.Ogawa S, et al. Abolition of male sexual behaviors in mice lacking estrogen receptors α and β (αβERKO). in Proc Natl Acad Sci U S A 14737–14741 (2000). [DOI] [PMC free article] [PubMed] [Google Scholar]
- 34.Takahashi A, Nagayasu K, Nishitani N, Kaneko S & Koide T Control of intermale aggression by medial prefrontal cortex activation in the mouse. Plos One 9, e94657 (2014). [DOI] [PMC free article] [PubMed] [Google Scholar]
- 35.Wong LC, et al. Effective Modulation of Male Aggression through Lateral Septum to Medial Hypothalamus Projection. Curr Biol 26, 593–604 (2016). [DOI] [PMC free article] [PubMed] [Google Scholar]
- 36.Gunaydin LA, et al. Natural neural projection dynamics underlying social behavior. Cell 157, 1535–1551 (2014). [DOI] [PMC free article] [PubMed] [Google Scholar]
- 37.Proulx CD, Hikosaka O & Malinow R Reward processing by the lateral habenula in normal and depressive behaviors. Nat Neurosci 17, 1146–1152 (2014). [DOI] [PMC free article] [PubMed] [Google Scholar]
- 38.Gentile TA, et al. Suvorexant, an orexin/hypocretin receptor antagonist, attenuates motivational and hedonic properties of cocaine. Addiction biology 23, 247–255 (2018). [DOI] [PMC free article] [PubMed] [Google Scholar]
- 39.Sartor GC & Aston-Jones GS A septal-hypothalamic pathway drives orexin neurons, which is necessary for conditioned cocaine preference. J Neurosci 32, 4623–4631 (2012). [DOI] [PMC free article] [PubMed] [Google Scholar]
- 40.Shoblock JR, et al. Selective blockade of the orexin-2 receptor attenuates ethanol self-administration, place preference, and reinstatement. Psychopharmacology (Berl) 215, 191–203 (2011). [DOI] [PubMed] [Google Scholar]
- 41.Gonzalez JA, Iordanidou P, Strom M, Adamantidis A & Burdakov D Awake dynamics and brain-wide direct inputs of hypothalamic MCH and orexin networks. Nat Commun 7, 11395 (2016). [DOI] [PMC free article] [PubMed] [Google Scholar]
- 42.Muschamp JW, Dominguez JM, Sato SM, Shen RY & Hull EM A role for hypocretin (orexin) in male sexual behavior. J Neurosci 27, 2837–2845 (2007). [DOI] [PMC free article] [PubMed] [Google Scholar]
- 43.Stamatakis AM, et al. Lateral Hypothalamic Area Glutamatergic Neurons and Their Projections to the Lateral Habenula Regulate Feeding and Reward. J Neurosci 36, 302–311 (2016). [DOI] [PMC free article] [PubMed] [Google Scholar]
- 44.Lin D, et al. Functional identification of an aggression locus in the mouse hypothalamus. Nature 470, 221–226 (2011). [DOI] [PMC free article] [PubMed] [Google Scholar]
- 45.Chemelli RM, et al. Narcolepsy in orexin knockout mice: molecular genetics of sleep regulation. Cell 98, 437–451 (1999). [DOI] [PubMed] [Google Scholar]
- 46.Herring WJ, et al. Suvorexant in Patients With Insomnia: Results From Two 3-Month Randomized Controlled Clinical Trials. Biol Psychiatry 79, 136–148 (2016). [DOI] [PubMed] [Google Scholar]
- 47.Malherbe P, et al. Biochemical and behavioural characterization of EMPA, a novel high-affinity, selective antagonist for the OX(2) receptor. Br J Pharmacol 156, 1326–1341 (2009). [DOI] [PMC free article] [PubMed] [Google Scholar]
- 48.Beig MI, Dampney BW & Carrive P Both Ox1r and Ox2r orexin receptors contribute to the cardiovascular and locomotor components of the novelty stress response in the rat. Neuropharmacology 89, 146–156 (2015). [DOI] [PubMed] [Google Scholar]
- 49.Todd WD, et al. A hypothalamic circuit for the circadian control of aggression. Nature Neuroscience 21, 717–724 (2018). [DOI] [PMC free article] [PubMed] [Google Scholar]
- 50.Mendoza J Circadian neurons in the lateral habenula: Clocking motivated behaviors. Pharmacology, biochemistry, and behavior 162, 55–61 (2017). [DOI] [PubMed] [Google Scholar]
- 51.Golden SA, et al. Persistent conditioned place preference to aggression experience in adult male sexually-experienced CD-1 mice. Genes Brain Behav 16, 44–55 (2017). [DOI] [PMC free article] [PubMed] [Google Scholar]
- 52.Couppis MH & Kennedy CH The rewarding effect of aggression is reduced by nucleus accumbens dopamine receptor antagonism in mice. Psychopharmacology (Berl) 197, 449–456 (2008). [DOI] [PubMed] [Google Scholar]
- 53.Stagkourakis S, Spigolon G, Williams P, Protzmann J, Fisone G, and Broberger C. A neural network for intermale aggression to establish social hierarchy. Nat Neurosci 21, 834–842 (2018). [DOI] [PubMed] [Google Scholar]
- 54.Golden SA, Covington HE 3rd, Berton O & Russo SJ A standardized protocol for repeated social defeat stress in mice. Nature protocols 6, 1183–1191 (2011). [DOI] [PMC free article] [PubMed] [Google Scholar]
- 55.Krishnan V, et al. Molecular adaptations underlying susceptibility and resistance to social defeat in brain reward regions. Cell 131, 391–404 (2007). [DOI] [PubMed] [Google Scholar]
- 56.Arendt DH, et al. Anxiolytic function of the orexin 2/hypocretin A receptor in the basolateral amygdala. Psychoneuroendocrinology 40, 17–26 (2014). [DOI] [PMC free article] [PubMed] [Google Scholar]
- 57.Whiddon BB & Palmiter RD Ablation of neurons expressing melanin-concentrating hormone (MCH) in adult mice improves glucose tolerance independent of MCH signaling. J Neurosci 33, 2009–2016 (2013). [DOI] [PMC free article] [PubMed] [Google Scholar]
- 58.Daviaud N, Friedel RH & Zou H Vascularization and Engraftment of Transplanted Human Cerebral Organoids in Mouse Cortex. eNeuro 5 (2018). [DOI] [PMC free article] [PubMed] [Google Scholar]
- 59.Arruda-Carvalho M & Clem RL Pathway-selective adjustment of prefrontal-amygdala transmission during fear encoding. J Neurosci 34, 15601–15609 (2014). [DOI] [PMC free article] [PubMed] [Google Scholar]
- 60.Petreanu L, Mao T, Sternson SM & Svoboda K The subcellular organization of neocortical excitatory connections. Nature 457, 1142–1145 (2009). [DOI] [PMC free article] [PubMed] [Google Scholar]
- 61.Schöne C & et al. Coreleased orexin and glutamate evoke nonredundant spike outputs and computations in histamine neurons. - PubMed - NCBI; (2014). [DOI] [PMC free article] [PubMed] [Google Scholar]
- 62.Calipari ES, et al. In vivo imaging identifies temporal signature of D1 and D2 medium spiny neurons in cocaine reward. Proc Natl Acad Sci U S A 113, 2726–2731 (2016). [DOI] [PMC free article] [PubMed] [Google Scholar]
- 63.Stagkourakis S, et al. A neural network for intermale aggression to establish social hierarchy. Nature Neuroscience 21, 834–842 (2018). [DOI] [PubMed] [Google Scholar]
Associated Data
This section collects any data citations, data availability statements, or supplementary materials included in this article.
Supplementary Materials
Data Availability Statement
The data that support these findings are available from the corresponding author upon request.


